Introduction
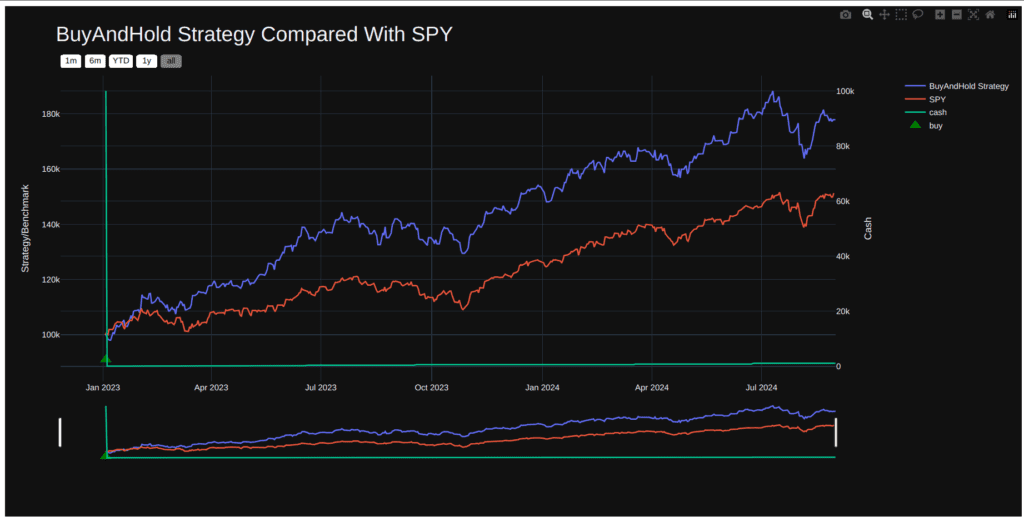
Backtesting is a crucial process for algorithmic traders, as it allows them to evaluate the performance of a strategy using historical data. By testing strategies in a simulated environment, traders can gain valuable insights into how their trading algorithm would perform without putting real money at risk. In this article, we will explore how to implement a simple Buy-and-Hold strategy using Lumibot and historical data from Polygon.io. This strategy involves purchasing a single asset and holding it over time, which is ideal for long-term investors.
Polygon.io offers reliable, high-quality financial data for backtesting, including minute-level and daily historical data. Unlike Yahoo Finance, which is limited to daily data, Polygon.io is well-suited for traders looking to backtest strategies with higher-frequency data. In this guide, we’ll use Polygon.io data to backtest a Buy-and-Hold strategy on an asset of your choice and analyze how it performs compared to a benchmark such as the S&P 500.
Let’s dive into the process of setting up Lumibot with Polygon.io data, implementing a Buy-and-Hold strategy, and performing a backtest to evaluate the strategy’s performance.
Implementing the Buy-and-Hold Strategy Using Lumibot and Polygon.io Data
This section explains how to set up and backtest a simple Buy-and-Hold strategy using Polygon.io data with the Lumibot algorithmic trading framework. The strategy buys a single asset and holds it for the entire backtesting period, aiming to simulate long-term investing behavior. Below is a breakdown of the key components of the code.
from datetime import datetime
from lumibot.strategies.strategy import Strategy

"""
Strategy Description

Simply buys one asset and holds onto it.
"""

class BuyAndHold(Strategy):
    parameters = {
        "buy_symbol": "AAPL",  # Change this to the asset symbol of your choice
    }

    # =====Overloading lifecycle methods=============

    def initialize(self):
        # Set the sleep time to one day (the strategy will run once per day)
        self.sleeptime = "1D"

    def on_trading_iteration(self):
        """Buys the self.buy_symbol once, then never again"""

        # Get the current datetime and log it
        dt = self.get_datetime()  # Used to get the time in the backtesting environment
        self.log_message(f"Current datetime: {dt}")

        # Get the symbol to buy from the parameters
        buy_symbol = self.parameters["buy_symbol"]

        # Get the current value of the symbol and log it
        current_value = self.get_last_price(buy_symbol)
        self.log_message(f"The value of {buy_symbol} is {current_value}")

        # Add a line to the indicator chart
        self.add_line(f"{buy_symbol} Value", current_value)

        # Get all the positions that we have
        all_positions = self.get_positions()

        # If we don't own anything (other than USD), buy the asset
        if len(all_positions) <= 1:  # Because we always have a cash position (USD)

            # Calculate the quantity to buy
            quantity = int(self.portfolio_value // current_value)

            # Create the order and submit it
            purchase_order = self.create_order(buy_symbol, quantity, "buy")
            self.submit_order(purchase_order)
Key Components of the Strategy Code
- dt = self.get_datetime(): This method retrieves the current date and time during the backtesting session. It ensures that the trades or actions taken by the algorithm are aligned with specific historical market events.
- self.add_line(f”{buy_symbol} Value”, current_value): This function adds the asset’s price data to a visual chart during backtesting. It tracks the value of the chosen asset over time, providing insight into its performance.
- all_positions = self.get_positions(): This function fetches all current positions held by the strategy, including cash. Since this is a Buy-and-Hold strategy, it checks if the portfolio already contains the chosen asset. If it doesn’t, it buys the asset and holds it throughout the backtesting period.
Backtesting the Strategy with Polygon.io Data
In this section, we’ll cover how to set up the backtest using historical data from Polygon.io. This data source provides more granular historical price data (such as minute-level data), which allows us to simulate the strategy with higher accuracy. Below is the code for setting up and running the backtest.
if __name__ == "__main__":
    IS_BACKTESTING = True

    if IS_BACKTESTING:
        from lumibot.backtesting import PolygonDataBacktesting

        # Backtest this strategy
        backtesting_start = datetime(2023, 1, 1)
        backtesting_end = datetime(2024, 9, 1)

        results = BuyAndHold.run_backtest(
            PolygonDataBacktesting,
            backtesting_start,
            backtesting_end,
            benchmark_asset="SPY",  # Use S&P 500 as a benchmark
        )

        # Print the results
        print(results)
    else:
        POLYGON_CONFIG = {
            "API_KEY": "YOUR_API_KEY",
        }

        from lumibot.brokers import Polygon
        from lumibot.traders import Trader

        trader = Trader()

        broker = Polygon(POLYGON_CONFIG)

        strategy = BuyAndHold(broker=broker)

        trader.add_strategy(strategy)
        strategy_executors = trader.run_all()
Key Points in the Backtesting Code
- IS_BACKTESTING = True: This flag determines whether the script will run in backtesting mode or live trading mode. When True, the strategy will backtest with historical data. In live trading mode, it connects to a real broker and executes live trades.
- PolygonDataBacktesting: This method loads historical price data from Polygon.io. Unlike Yahoo Finance, Polygon.io supports minute-level data, making it suitable for testing short-term strategies. However, in this case, we use daily data for a Buy-and-Hold strategy.
- Backtest Period: The strategy is tested between January 1, 2023, and September 1, 2024. During this period, the performance of the asset will be compared to a benchmark like the S&P 500.
Complete Code
from datetime import datetime

from lumibot.strategies.strategy import Strategy

"""
Strategy Description

Simply buys one asset and holds onto it.
"""


class BuyAndHold(Strategy):
    parameters = {
        "buy_symbol": "QQQ",
    }

    # =====Overloading lifecycle methods=============

    def initialize(self):
        # Set the sleep time to one day (the strategy will run once per day)
        self.sleeptime = "1M"

    def on_trading_iteration(self):
        """Buys the self.buy_symbol once, then never again"""

        # Get the current datetime and log it
        dt = self.get_datetime() # We use this function so that we get the time in teh backtesting environment
        self.log_message(f"Current datetime: {dt}")

        # Get the symbol to buy from the parameters
        buy_symbol = self.parameters["buy_symbol"]

        # Get the current value of the symbol and log it
        current_value = self.get_last_price(buy_symbol)
        self.log_message(f"The value of {buy_symbol} is {current_value}")

        # Add a line to the indicator chart
        self.add_line(f"{buy_symbol} Value", current_value)

        # Get all the positions that we have
        all_positions = self.get_positions()

        # If we don't own anything (other than USD), buy the asset
        if len(all_positions) <= 1:  # Because we always have a cash position (USD)

            # Calculate the quantity to buy
            quantity = int(self.portfolio_value // current_value)

            # Create the order and submit it
            purchase_order = self.create_order(buy_symbol, quantity, "buy")
            self.submit_order(purchase_order)


if __name__ == "__main__":
    IS_BACKTESTING = True

    if IS_BACKTESTING:
        from lumibot.backtesting import PolygonDataBacktesting

        # Backtest this strategy
        backtesting_start = datetime(2024, 1, 1)
        backtesting_end = datetime(2024, 9, 1)

        results = BuyAndHold.run_backtest(
            PolygonDataBacktesting,
            backtesting_start,
            backtesting_end,
            benchmark_asset="SPY",
            polygon_api_key="tYtRp9IBM_t8NbsE6cKGEF33XwlFprCv",
        )

        # Print the results
        print(results)
    else:
        ALPACA_CONFIG = {
            "API_KEY": "YOUR_API_KEY",
            "API_SECRET": "YOUR_API_SECRET",
            "PAPER": True,
        }

        from lumibot.brokers import Alpaca
        from lumibot.traders import Trader

        trader = Trader()

        broker = Alpaca(ALPACA_CONFIG)

        strategy = BuyAndHold(broker=broker)

        trader.add_strategy(strategy)
        strategy_executors = trader.run_all()
Output Files and Key Metrics Explained
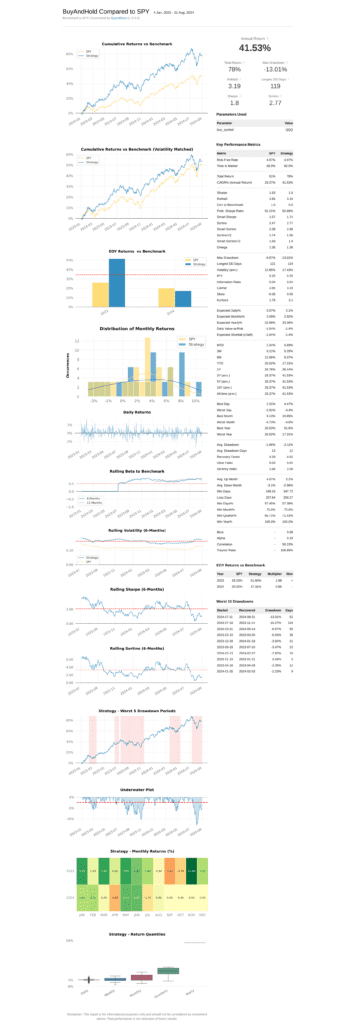
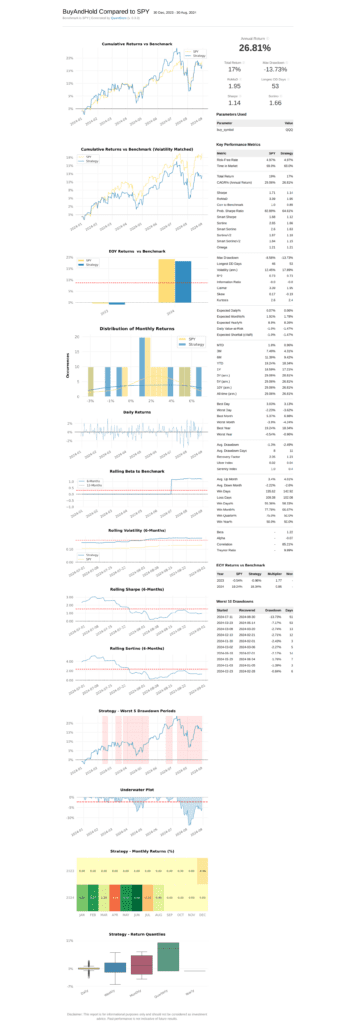
Once the backtest is complete, Lumibot generates several important output files. These files contain detailed information about the performance of the strategy, including a tearsheet, indicators, and a trades file. Below is an overview of what each file contains and how to interpret the results.
1. Tearsheet.html / Tearsheet.csv
The tearsheet file provides a comprehensive report on the strategy’s performance, including various metrics that measure profitability and risk. Some key metrics include:
- Total Return: The overall return generated by the strategy during the backtesting period.
- CAGR (Compound Annual Growth Rate): The average annual growth rate over the backtest period.
- Sharpe Ratio: A measure of risk-adjusted return.
- Max Drawdown: The maximum decline in portfolio value from peak to trough.
- Sortino Ratio: A variation of the Sharpe Ratio that penalizes only downside risk.
Output for Polygon.io Backtesting
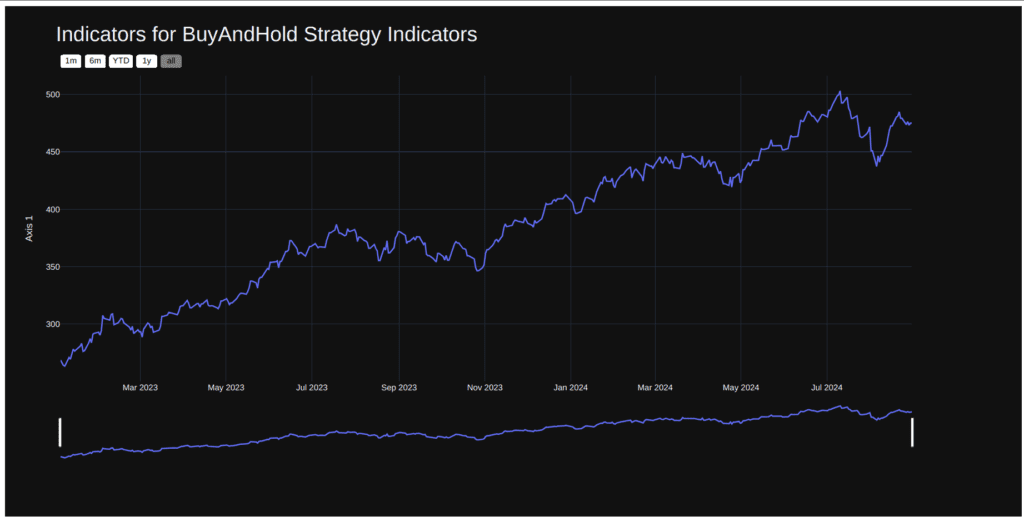
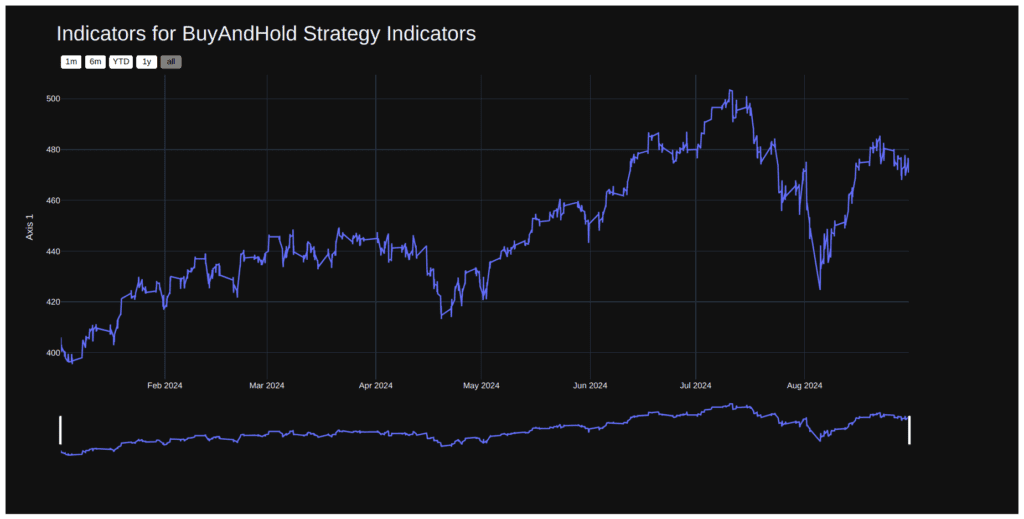
2. Indicators.html / Indicators.csv
The indicators file records all technical indicators used in the strategy. These values can be reviewed to understand how the strategy reacts to various market conditions.
Output for Polygon.io Backtesting
3. Trades.html / Trades.csv
The trades file logs every trade executed by the strategy during the backtest. It includes data like the trade timestamp, symbol, buy/sell action, trade price, and the profit or loss for each transaction.
Output for Polygon.io Backtesting
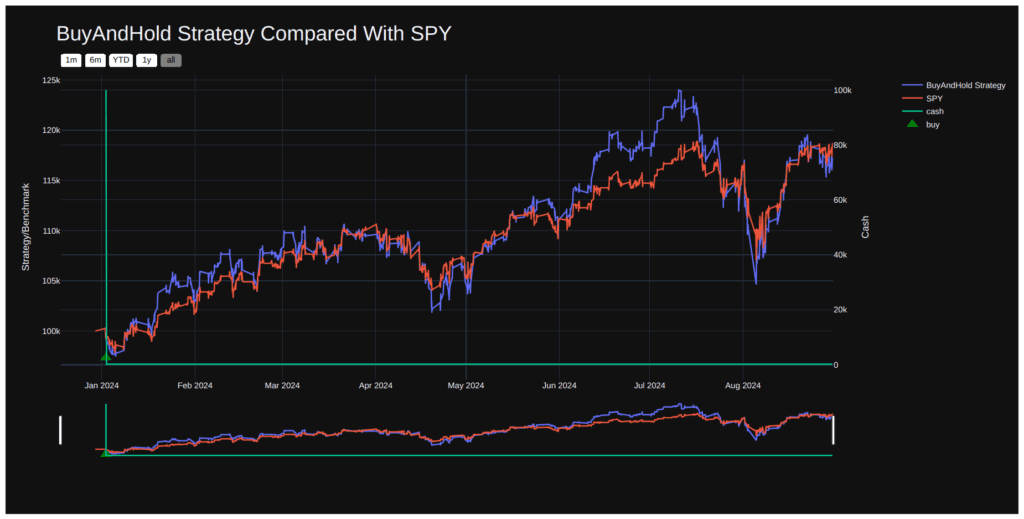
Conclusion
By using Polygon.io’s comprehensive data and Lumibot’s robust backtesting framework, we can evaluate the effectiveness of a simple Buy-and-Hold strategy. Polygon.io’s minute-level data is particularly valuable for testing strategies that require more granularity than daily data, making it ideal for a wide range of strategies beyond just long-term investing.
The Buy-and-Hold strategy is a great starting point for understanding backtesting, but you can build more complex strategies using Lumibot and Polygon.io data. Whether you are a beginner or an experienced algorithmic trader, this combination offers the tools and data needed to test and improve your strategies efficiently.

