Categories
Algorithmic Trading

Placing Stock Orders Using Lumibot: A Practical Approach

Introduction

Algorithmic trading has revolutionized the stock market by offering several advantages over manual trading. Trading bots have become a critical tool for traders who are looking to gain a competitive edge. Platforms like Lumibot provide a robust solution by allowing traders to automate their strategies with speed and precision that manual traders cannot match by responding instantly to market conditions and taking advantage of fleeting opportunities.  

At its core, Lumibot is a Python-based open-source trading platform designed for those who want to automate their stock trades using algorithms. It integrates with various brokers like Alpaca and Interactive Brokers, making it accessible to a wide range of users. In this blog, we’ll explore the practical steps to place stock orders using Lumibot. 

Let’s explore the installation process, how to connect with your brokerage and the different types of stock orders you can place, such as market, limit, and stop orders. 

Why is Lumibot a Smart Choice For Placing Stock Orders?

Lumibot is a highly flexible algorithmic trading framework that provides distinct advantages for those looking to enhance their stock trading experience. Let’s see some of its powerful benefits below: 

1. Automation of Trading Strategies

Lumibot ensures consistent execution of a pre-defined logic without constant monitoring. Once a strategy is coded and deployed, it can operate 24/7, maximizing opportunities in the stock market. For example, strategies like “buy low, sell high” or “buy and hold” can be automatically executed based on real-time market conditions, without the need for human intervention.

2. Speed and Precision in Order Execution

Timing is critical in the stock market. Lumibot’s algorithmic approach ensures that trades are placed almost instantly as soon as market conditions trigger the predefined criteria. This speed and precision allow traders to capitalize on short-lived opportunities, such as sudden market shifts or price gaps, that would be impossible to execute manually.

Moreover, Lumibot integrates with multiple brokers, including Alpaca and Interactive Brokers, ensuring that orders are routed through highly reliable platforms, reducing the risk of trade failure or slippage.

    3. Backtesting for Strategy Optimization

    One of the most powerful features of Lumibot is its ability to backtest trading strategies. Backtesting allows traders to evaluate their strategies against historical market data, providing a clear picture of the strategy’s performance before it is deployed in live markets. By using historical data to simulate past market conditions, traders can identify the strengths and weaknesses of their strategies, refine them, and improve profitability.

    4. Integration with Various Brokers and Data Providers

    Another advantage of using Lumibot is its seamless integration with popular brokerage platforms such as Alpaca, Interactive Brokers, and others. This allows traders to connect their trading bots directly to their brokerage accounts, making it easy to execute trades across different asset classes including stocks, ETFs, and options.

      5. Paper Trading for Low-Risk Strategy Testing

      For those hesitant to dive into live trading with real money, Lumibot offers a paper trading feature. This allows users to simulate real-world trading conditions without putting actual capital at risk. By executing their strategies in paper trading mode, traders can gain confidence in their algorithms, observe how they perform in real-time markets, and make adjustments before switching to live trading.

      The Prerequisites Before Placing a Stock Order

      To start placing stock orders using Lumibot, a user needs to follow the preparatory steps mentioned below. This installation process is quite straightforward if you are familiar with Python

      Step 1: Install Python

      The user must install Python in their system with version 3.10 or above. You can download the recent version of Python here

      Step 2: Set Up Lumibot

      The user must first install Lumibot using pip: pip install Lumibot from the terminal.

      pip install lumibot

      Step 3: Run Python 

      Once Lumibot has been installed, you have to run the Python file by importing the classes below. 

      import lumibot
      from lumibot.strategies import Strategy
      from lumibot.entities import Asset
      from lumibot.traders import Trader
      from datetime import datetime

      Step 4: Create ALPACA_CONFIG 

      Finally, the user has to create ALPACA_CONFIG with API KEY and API SECRET by logging in or signing up at https://alpaca.markets/

      Steps to Placing Stock Orders Using Lumibot

      Step 1: Import the Required Libraries

      Begin by importing necessary modules, such as datetime to handle date and time functionalities, and Strategy from the Lumibot framework to define the trading strategy.

      from datetime import datetime
      from lumibot.strategies.strategy import Strategy

      Step 2: Define the Buy-and-Hold Strategy Class

      Create a class BuyAndHoldStock that inherits from the Strategy class provided by Lumibot. This class contains the core logic for the strategy.

      class BuyAndHoldStock(Strategy):

      Step 3: Set Parameters for the Strategy

      Define a parameters dictionary to specify the stock symbol you want to buy. In this example, the stock symbol is set to “AAPL” by default.

      # Parameters for the strategy, currently only the stock symbol to buy
          parameters = {
              "buy_symbol": "AAPL",  # The stock symbol to buy, default is AAPL
          }

      Step 4: Initialize the Strategy

      Define the initialize method to set how often the trading loop will run. Here, the bot will execute the strategy iteration every minute, which is indicated by the “1M” sleeptime.

      def initialize(self):
              # Set how often the trading iteration will run (e.g., every 1 minute)
              self.sleeptime = "1M"

      Step 5: Implement the Trading Logic in on_trading_iteration

      The on_trading_iteration method is the core function where the strategy executes its logic on each trading iteration. In this step:

      • Log Current Time: The bot logs the current datetime to track when the trade is being executed.
       def on_trading_iteration(self):
              """Buys the specified stock once, then holds it"""   
      # Log the current datetime
              current_time = self.get_datetime()
              self.log_message(f"Current datetime: {current_time}")
      • Retrieve Stock Symbol: Extract the stock symbol (e.g., “AAPL”) from the parameters.
      # Retrieve the stock symbol from the parameters
              stock_symbol = self.parameters["buy_symbol"]
      • Fetch Current Stock Price: The bot gets the latest stock price for the specified symbol and logs it.
      # Get the latest price of the stock
              stock_price = self.get_last_price(stock_symbol)
              self.log_message(f"The price of {stock_symbol} is {stock_price}")
      • Visualize Stock Price: Add the stock price to a custom line chart for monitoring and visualization purposes.
      # Add the stock price to a custom line chart for visualization
              self.add_line(f"{stock_symbol} Price", stock_price)

      Step 6: Check Existing Portfolio Positions

      Check the current positions in the portfolio.

      # Get the current portfolio positions
              current_positions = self.get_positions()

      Step 7: Calculate Quantity and Place a Buy Order

      If there are no stock holdings, the bot calculates how many shares of the stock to buy based on the available portfolio value. It then creates and submits a buy order.

      • Calculate Quantity: Divide the portfolio value by the stock price to determine how many shares to buy.
      # If the only position is USD, buy the stock
              if len(current_positions) <= 1:  # Assuming only USD is present
                  # Calculate how much stock to buy based on available portfolio value
                  quantity_to_buy = int(self.portfolio_value // stock_price)
                  self.log_message(f"Quantity to buy: {quantity_to_buy}")
      • Create and Submit the Buy Order: Once the quantity is calculated, the bot creates and submits the buy order for execution.
      # Create and submit the buy order
                  buy_order = self.create_order(stock_symbol, quantity_to_buy, "buy")
                  self.submit_order(buy_order)

      This will allow the bot to monitor the market automatically and place a buy order for the stock, holding it after the first purchase.

      Backtesting Your Strategy With Lumibot

      One of the greatest advantages of using Lumibot is the ability to backtest your strategies before deploying them in live trading environments. The backtest will simulate how the strategy would have performed over a historical period.

      if __name__ == "__main__":
          IS_BACKTESTING = True
          
          if IS_BACKTESTING:
              from lumibot.backtesting import PolygonDataBacktesting
              
              # Set up the backtest period
              backtest_start = datetime(2024, 1, 1)
              backtest_end = datetime(2024, 9, 1)
              
              # Run the backtest with SPY as the benchmark asset
              results = BuyAndHoldStock.run_backtest(
                  PolygonDataBacktesting,
                  backtest_start,
                  backtest_end,
                  benchmark_asset="SPY",
                  polygon_api_key="",  # Add your Polygon API key here
              )
              print(results) 
          else:
              # Check if Alpaca API keys are set
              ALPACA_CONFIG = {
                  "API_KEY": "",  # Add your Alpaca API Key here
                  "API_SECRET": "",  # Add your Alpaca API Secret here
                  "PAPER": False,  # Set to True for paper trading, False for live trading
              }
              
              # Throw an error if the API keys are not set
              if not ALPACA_CONFIG["API_KEY"] or not ALPACA_CONFIG["API_SECRET"]:
                  raise ValueError("Please set your Alpaca API key and secret in the ALPACA_CONFIG.")
              
              from lumibot.brokers import Alpaca
              from lumibot.traders import Trader
              
              # Set up the Alpaca broker and run the strategy
              broker = Alpaca(ALPACA_CONFIG)
              strategy = BuyAndHoldStock(broker=broker)
              trader = Trader()
              trader.add_strategy(strategy)
              trader.run_all()

      Key Points in the Backtesting Code

      • IS_BACKTESTING = True: his flag determines whether the script runs in backtesting mode or live trading mode. When set to backtesting mode, it uses historical data to simulate trades. In live mode, the strategy interacts with a real broker to execute actual trades.
      • Backtest Period: The strategy is tested between January 1, 2023, and September 1, 2024. 

      Complete Code

      from datetime import datetime
      from lumibot.strategies.strategy import Strategy
      
      class BuyAndHoldStock(Strategy):
         # Parameters for the strategy, currently only the stock symbol to buy
         parameters = {
         	"buy_symbol": "AAPL",  # The stock symbol to buy, default is AAPL
         }
      
         def initialize(self):
         	# Set how often the trading iteration will run (e.g., every 1 minute)
             self.sleeptime = "1M"
      
         def on_trading_iteration(self):
         	"""Buys the specified stock once, then holds it"""
         	
         	# Log the current datetime
             current_time = self.get_datetime()
             self.log_message(f"Current datetime: {current_time}")
         	
         	# Retrieve the stock symbol from the parameters
             stock_symbol = self.parameters["buy_symbol"]
         	
         	# Get the latest price of the stock
             stock_price = self.get_last_price(stock_symbol)
             self.log_message(f"The price of {stock_symbol} is {stock_price}")
         	
         	# Add the stock price to a custom line chart for visualization
             self.add_line(f"{stock_symbol} Price", stock_price)
         	
         	# Get the current portfolio positions
             current_positions = self.get_positions()
         	
         	# If the only position is USD, buy the stock
         	if len(current_positions) <= 1:  # Assuming only USD is present
             	# Calculate how much stock to buy based on available portfolio value
                 quantity_to_buy = int(self.portfolio_value // stock_price)
                 self.log_message(f"Quantity to buy: {quantity_to_buy}")
             	
             	# Create and submit the buy order
                 buy_order = self.create_order(stock_symbol, quantity_to_buy, "buy")
                 self.submit_order(buy_order)
      
      if __name__ == "__main__":
         IS_BACKTESTING = True
        
         if IS_BACKTESTING:
         	from lumibot.backtesting import PolygonDataBacktesting
         	
         	# Set up the backtest period
             backtest_start = datetime(2024, 1, 1)
             backtest_end = datetime(2024, 9, 1)
         	
         	# Run the backtest with SPY as the benchmark asset
             results = BuyAndHoldStock.run_backtest(
                 PolygonDataBacktesting,
                 backtest_start,
                 backtest_end,
                 benchmark_asset="SPY",
                 polygon_api_key="",  # Add your Polygon API key here
             )
         	print(results)
        
         else:
         	# Check if Alpaca API keys are set
             ALPACA_CONFIG = {
             	"API_KEY": "",  # Add your Alpaca API Key here
             	"API_SECRET": "",  # Add your Alpaca API Secret here
             	"PAPER": False,  # Set to True for paper trading, False for live trading
             }
         	
         	# Throw an error if the API keys are not set
         	if not ALPACA_CONFIG["API_KEY"] or not ALPACA_CONFIG["API_SECRET"]:
             	raise ValueError("Please set your Alpaca API key and secret in the ALPACA_CONFIG.")
         	
         	from lumibot.brokers import Alpaca
         	from lumibot.traders import Trader
         	
         	# Set up the Alpaca broker and run the strategy
             broker = Alpaca(ALPACA_CONFIG)
             strategy = BuyAndHoldStock(broker=broker)
             trader = Trader()
             trader.add_strategy(strategy)
             trader.run_all()

      Output and Key Metrics Explained

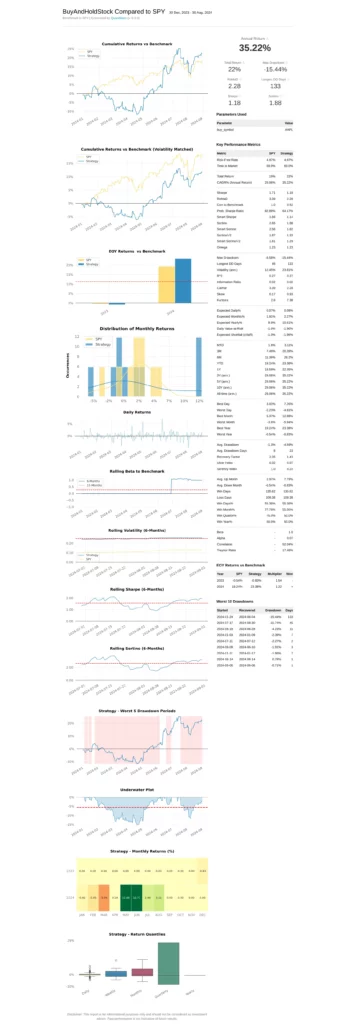
      After completing the backtest, Lumibot produces several key output files that provide in-depth insights into the strategy’s performance. These files include a tearsheet, indicators, and a trades file. Below is a summary of each file’s contents and how to understand the results.

      1. Tearsheet.html / Tearsheet.csv

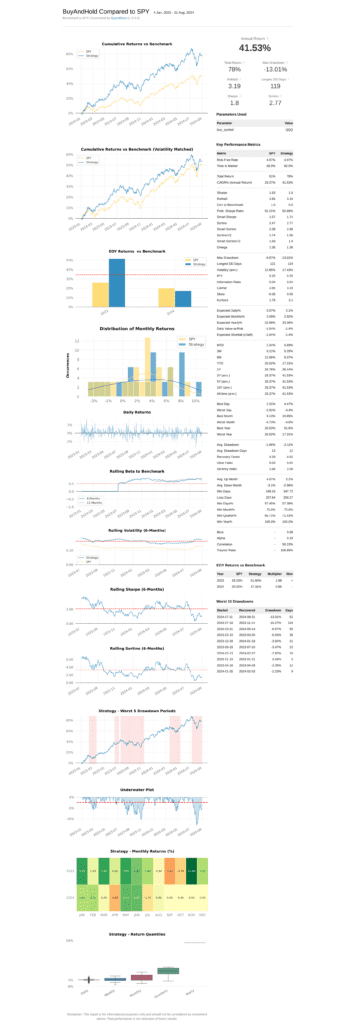
      The tearsheet offers a detailed report on the strategy’s performance, featuring essential metrics that assess profitability and risk. Key metrics include:

      • Total Return: The overall profit generated by the strategy during the backtesting period.
      • CAGR (Compound Annual Growth Rate): The average annual growth rate over the backtest duration.
      • Sharpe Ratio: A metric that evaluates risk-adjusted returns.
      • Max Drawdown: The largest drop in portfolio value from its highest point to its lowest.
      • Sortino Ratio: A modified version of the Sharpe Ratio that focuses specifically on downside risk.

      Output for Stock Order Backtesting
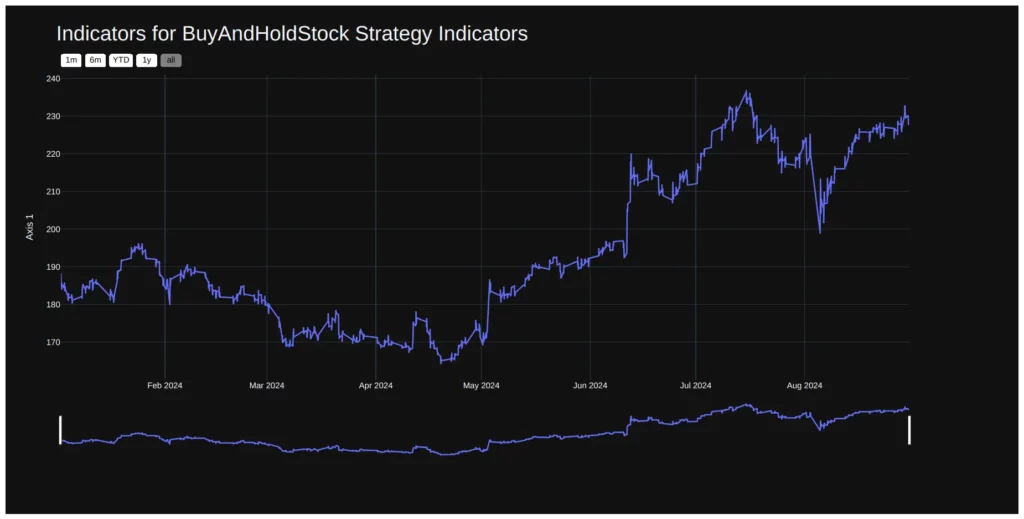
      2. Indicators.html / Indicators.csv

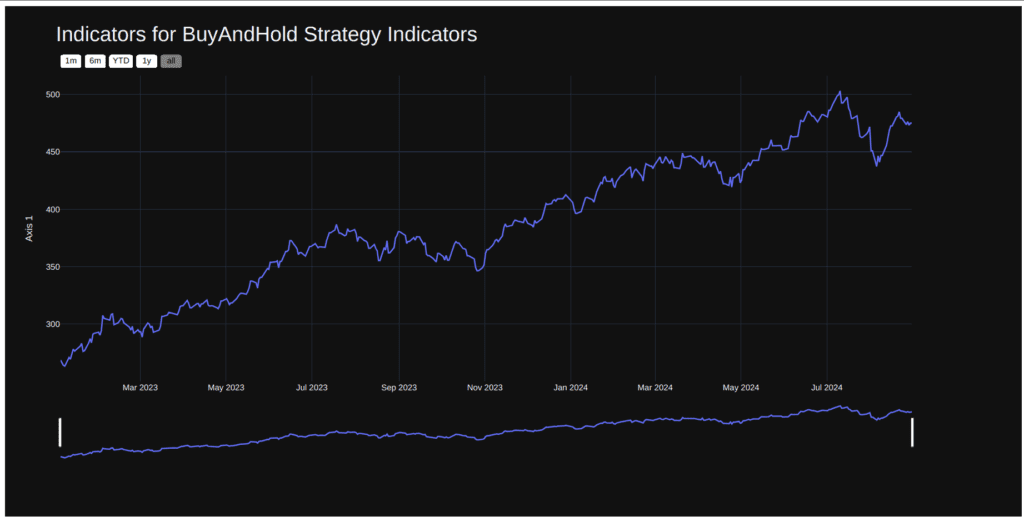
      The indicators file logs all technical indicators utilized in the strategy. Reviewing these values allows you to see how the strategy responds to different market conditions. Key contents of indicators file include: 

      • Indicator Values Over Time:This section includes moving averages, RSI, MACD, Bollinger Bands, and other indicators used by the strategy, showing how these values change over time and relate to the strategy’s buy/sell actions.
        • Custom Strategy Metrics: If the strategy tracks custom metrics such as portfolio value, cash position, or specific thresholds, these will also be included in the file.

        Output for Stock Order Backtesting
        3. Trades.html / Trades.csv

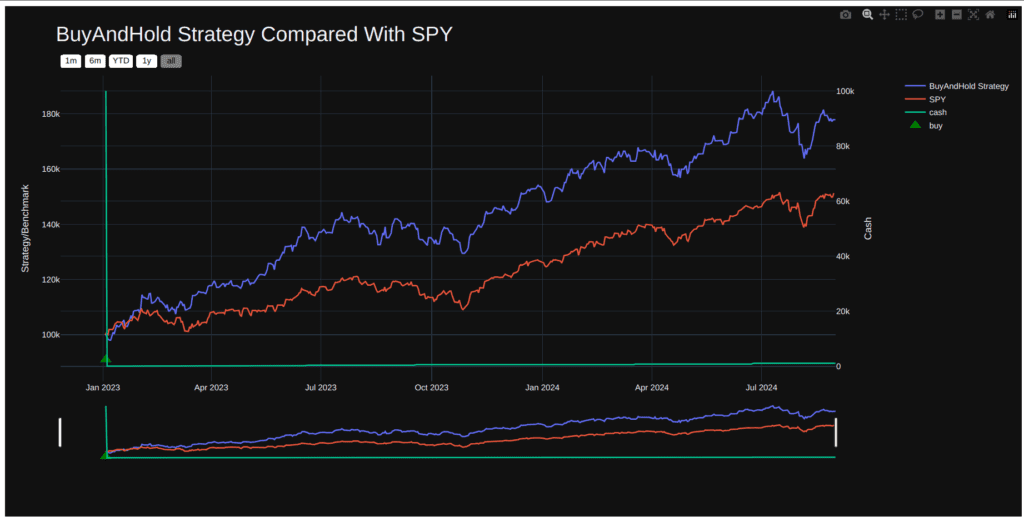
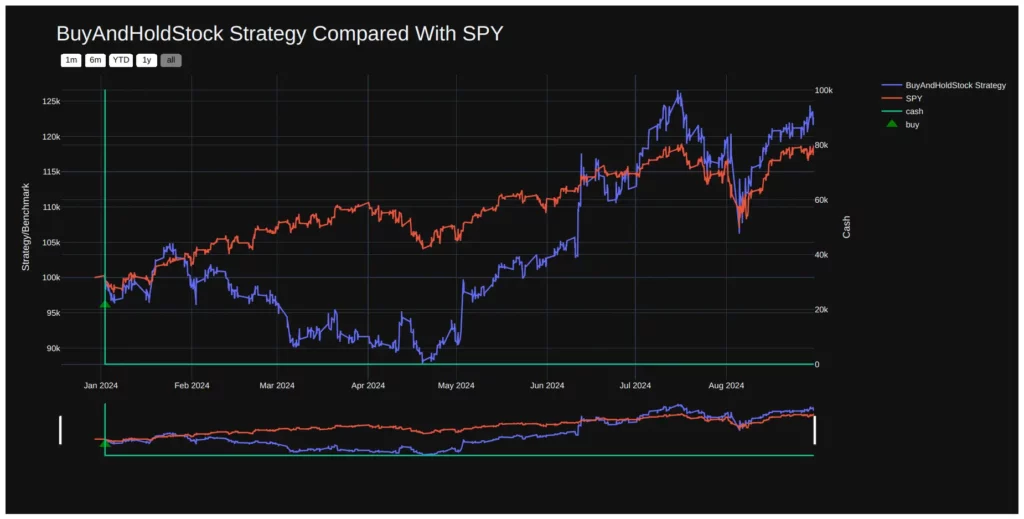
        The trades file documents every trade made by the strategy during the backtest, detailing information such as the trade timestamp, symbol, buy/sell action, trade price, and the profit or loss for each transaction. Key contents of trades file include:

        • Trade Timestamp: The date and time each trade was executed.
        • Symbol: The asset being traded (e.g., QQQ).
        • Buy/Sell Action: Indicates if the trade was a buy or sell.
        • Trade Price: The price at which the asset was traded.
        • Quantity: The number of units (e.g., shares or contracts) involved.
        • Profit/Loss: The profit or loss from each trade, helping identify successful trades.
        • Order Type: Specifies whether the order was market, limit, or another type.

        Output for Stock Order Backtesting
        Conclusion

        Placing stock orders using Lumibot can be a highly efficient way to automate your trading strategies. Whether you are executing simple market orders or more complex limit and stop orders, Lumibot provides the flexibility and precision that is needed to optimize your trading approach. Moreover, it has features like backtesting and paper trading, making it possible for you to refine your strategies without risking capital.

        By understanding the different types of stock orders, setting up your brokerage account, and utilizing Lumibot’s rich functionality, you can take advantage of algorithmic trading and improve your overall market performance.

        Categories
        Algorithmic Trading

        Backtesting Strategies Using Polygon.io Data with Lumibot

        Introduction

        Backtesting is a crucial process for algorithmic traders, as it allows them to evaluate the performance of a strategy using historical data. By testing strategies in a simulated environment, traders can gain valuable insights into how their trading algorithm would perform without putting real money at risk. In this article, we will explore how to implement a simple Buy-and-Hold strategy using Lumibot and historical data from Polygon.io. This strategy involves purchasing a single asset and holding it over time, which is ideal for long-term investors.

        Polygon.io offers reliable, high-quality financial data for backtesting, including minute-level and daily historical data. Unlike Yahoo Finance, which is limited to daily data, Polygon.io is well-suited for traders looking to backtest strategies with higher-frequency data. In this guide, we’ll use Polygon.io data to backtest a Buy-and-Hold strategy on an asset of your choice and analyze how it performs compared to a benchmark such as the S&P 500.

        Let’s dive into the process of setting up Lumibot with Polygon.io data, implementing a Buy-and-Hold strategy, and performing a backtest to evaluate the strategy’s performance.

        Implementing the Buy-and-Hold Strategy Using Lumibot and Polygon.io Data

        This section explains how to set up and backtest a simple Buy-and-Hold strategy using Polygon.io data with the Lumibot algorithmic trading framework. The strategy buys a single asset and holds it for the entire backtesting period, aiming to simulate long-term investing behavior. Below is a breakdown of the key components of the code.

        from datetime import datetime
        from lumibot.strategies.strategy import Strategy
        
        """
        Strategy Description
        
        Simply buys one asset and holds onto it.
        """
        
        class BuyAndHold(Strategy):
            parameters = {
                "buy_symbol": "AAPL",  # Change this to the asset symbol of your choice
            }
        
            # =====Overloading lifecycle methods=============
        
            def initialize(self):
                # Set the sleep time to one day (the strategy will run once per day)
                self.sleeptime = "1D"
        
            def on_trading_iteration(self):
                """Buys the self.buy_symbol once, then never again"""
        
                # Get the current datetime and log it
                dt = self.get_datetime()  # Used to get the time in the backtesting environment
                self.log_message(f"Current datetime: {dt}")
        
                # Get the symbol to buy from the parameters
                buy_symbol = self.parameters["buy_symbol"]
        
                # Get the current value of the symbol and log it
                current_value = self.get_last_price(buy_symbol)
                self.log_message(f"The value of {buy_symbol} is {current_value}")
        
                # Add a line to the indicator chart
                self.add_line(f"{buy_symbol} Value", current_value)
        
                # Get all the positions that we have
                all_positions = self.get_positions()
        
                # If we don't own anything (other than USD), buy the asset
                if len(all_positions) <= 1:  # Because we always have a cash position (USD)
        
                    # Calculate the quantity to buy
                    quantity = int(self.portfolio_value // current_value)
        
                    # Create the order and submit it
                    purchase_order = self.create_order(buy_symbol, quantity, "buy")
                    self.submit_order(purchase_order)
        

        Key Components of the Strategy Code

        • dt = self.get_datetime(): This method retrieves the current date and time during the backtesting session. It ensures that the trades or actions taken by the algorithm are aligned with specific historical market events.
        • self.add_line(f”{buy_symbol} Value”, current_value): This function adds the asset’s price data to a visual chart during backtesting. It tracks the value of the chosen asset over time, providing insight into its performance.
        • all_positions = self.get_positions(): This function fetches all current positions held by the strategy, including cash. Since this is a Buy-and-Hold strategy, it checks if the portfolio already contains the chosen asset. If it doesn’t, it buys the asset and holds it throughout the backtesting period.

        Backtesting the Strategy with Polygon.io Data

        In this section, we’ll cover how to set up the backtest using historical data from Polygon.io. This data source provides more granular historical price data (such as minute-level data), which allows us to simulate the strategy with higher accuracy. Below is the code for setting up and running the backtest.

        if __name__ == "__main__":
            IS_BACKTESTING = True
        
            if IS_BACKTESTING:
                from lumibot.backtesting import PolygonDataBacktesting
        
                # Backtest this strategy
                backtesting_start = datetime(2023, 1, 1)
                backtesting_end = datetime(2024, 9, 1)
        
                results = BuyAndHold.run_backtest(
                    PolygonDataBacktesting,
                    backtesting_start,
                    backtesting_end,
                    benchmark_asset="SPY",  # Use S&P 500 as a benchmark
                )
        
                # Print the results
                print(results)
            else:
                POLYGON_CONFIG = {
                    "API_KEY": "YOUR_API_KEY",
                }
        
                from lumibot.brokers import Polygon
                from lumibot.traders import Trader
        
                trader = Trader()
        
                broker = Polygon(POLYGON_CONFIG)
        
                strategy = BuyAndHold(broker=broker)
        
                trader.add_strategy(strategy)
                strategy_executors = trader.run_all()
        

        Key Points in the Backtesting Code

        • IS_BACKTESTING = True: This flag determines whether the script will run in backtesting mode or live trading mode. When True, the strategy will backtest with historical data. In live trading mode, it connects to a real broker and executes live trades.
        • PolygonDataBacktesting: This method loads historical price data from Polygon.io. Unlike Yahoo Finance, Polygon.io supports minute-level data, making it suitable for testing short-term strategies. However, in this case, we use daily data for a Buy-and-Hold strategy.
        • Backtest Period: The strategy is tested between January 1, 2023, and September 1, 2024. During this period, the performance of the asset will be compared to a benchmark like the S&P 500.

        Complete Code

        from datetime import datetime
         
        from lumibot.strategies.strategy import Strategy
         
        """
        Strategy Description
         
        Simply buys one asset and holds onto it.
        """
         
         
        class BuyAndHold(Strategy):
            parameters = {
                "buy_symbol": "QQQ",
            }
         
            # =====Overloading lifecycle methods=============
         
            def initialize(self):
                # Set the sleep time to one day (the strategy will run once per day)
                self.sleeptime = "1M"
         
            def on_trading_iteration(self):
                """Buys the self.buy_symbol once, then never again"""
         
                # Get the current datetime and log it
                dt = self.get_datetime() # We use this function so that we get the time in teh backtesting environment
                self.log_message(f"Current datetime: {dt}")
         
                # Get the symbol to buy from the parameters
                buy_symbol = self.parameters["buy_symbol"]
         
                # Get the current value of the symbol and log it
                current_value = self.get_last_price(buy_symbol)
                self.log_message(f"The value of {buy_symbol} is {current_value}")
         
                # Add a line to the indicator chart
                self.add_line(f"{buy_symbol} Value", current_value)
         
                # Get all the positions that we have
                all_positions = self.get_positions()
         
                # If we don't own anything (other than USD), buy the asset
                if len(all_positions) <= 1:  # Because we always have a cash position (USD)
         
                    # Calculate the quantity to buy
                    quantity = int(self.portfolio_value // current_value)
         
                    # Create the order and submit it
                    purchase_order = self.create_order(buy_symbol, quantity, "buy")
                    self.submit_order(purchase_order)
         
         
        if __name__ == "__main__":
            IS_BACKTESTING = True
         
            if IS_BACKTESTING:
                from lumibot.backtesting import PolygonDataBacktesting
         
                # Backtest this strategy
                backtesting_start = datetime(2024, 1, 1)
                backtesting_end = datetime(2024, 9, 1)
         
                results = BuyAndHold.run_backtest(
                    PolygonDataBacktesting,
                    backtesting_start,
                    backtesting_end,
                    benchmark_asset="SPY",
                    polygon_api_key="tYtRp9IBM_t8NbsE6cKGEF33XwlFprCv",
                )
         
                # Print the results
                print(results)
            else:
                ALPACA_CONFIG = {
                    "API_KEY": "YOUR_API_KEY",
                    "API_SECRET": "YOUR_API_SECRET",
                    "PAPER": True,
                }
         
                from lumibot.brokers import Alpaca
                from lumibot.traders import Trader
         
                trader = Trader()
         
                broker = Alpaca(ALPACA_CONFIG)
         
                strategy = BuyAndHold(broker=broker)
         
                trader.add_strategy(strategy)
                strategy_executors = trader.run_all()

        Output Files and Key Metrics Explained

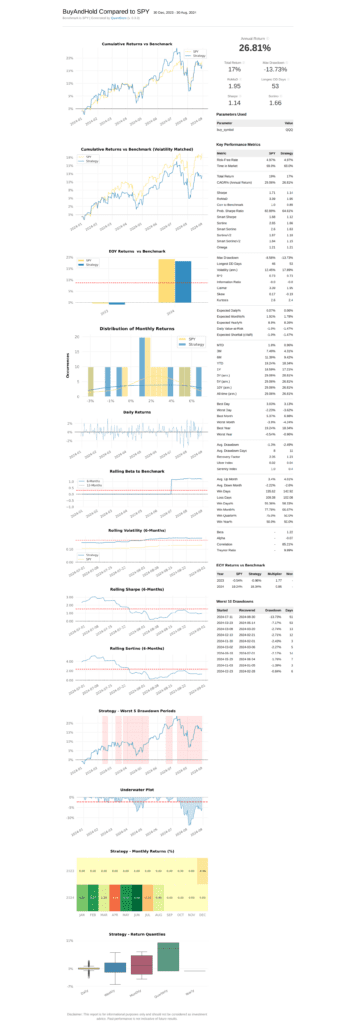
        Once the backtest is complete, Lumibot generates several important output files. These files contain detailed information about the performance of the strategy, including a tearsheet, indicators, and a trades file. Below is an overview of what each file contains and how to interpret the results.

        1. Tearsheet.html / Tearsheet.csv

        The tearsheet file provides a comprehensive report on the strategy’s performance, including various metrics that measure profitability and risk. Some key metrics include:

        • Total Return: The overall return generated by the strategy during the backtesting period.
        • CAGR (Compound Annual Growth Rate): The average annual growth rate over the backtest period.
        • Sharpe Ratio: A measure of risk-adjusted return.
        • Max Drawdown: The maximum decline in portfolio value from peak to trough.
        • Sortino Ratio: A variation of the Sharpe Ratio that penalizes only downside risk.

        Output for Polygon.io Backtesting

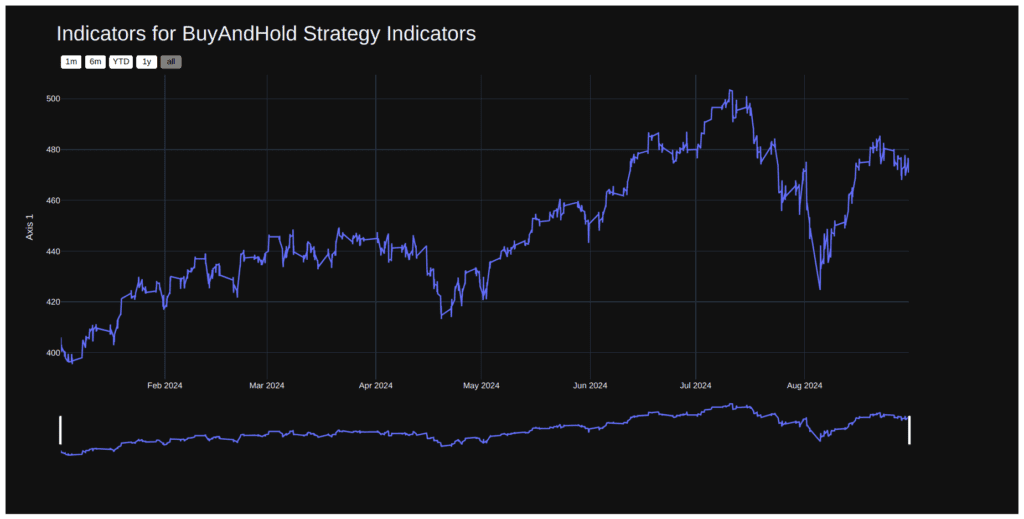
        2. Indicators.html / Indicators.csv

        The indicators file records all technical indicators used in the strategy. These values can be reviewed to understand how the strategy reacts to various market conditions.

        Output for Polygon.io Backtesting

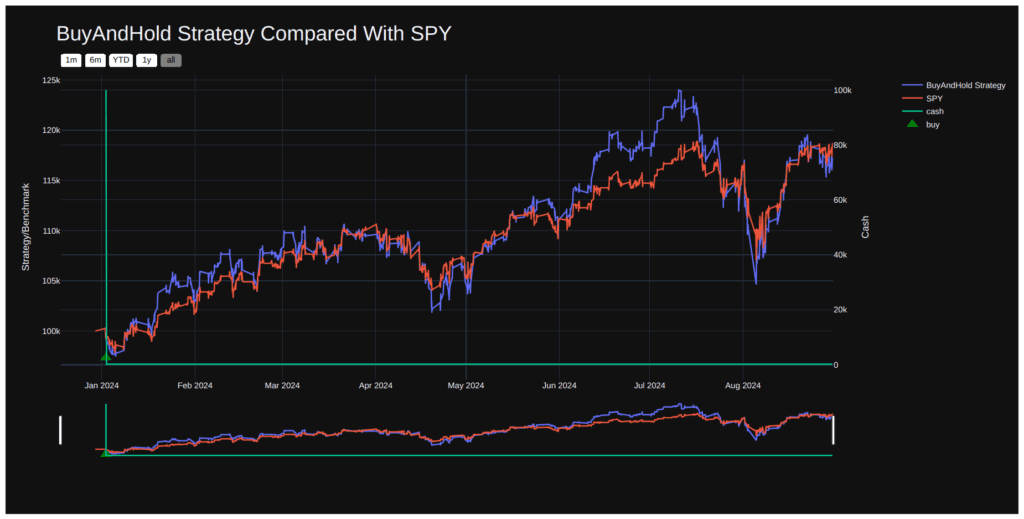
        3. Trades.html / Trades.csv

        The trades file logs every trade executed by the strategy during the backtest. It includes data like the trade timestamp, symbol, buy/sell action, trade price, and the profit or loss for each transaction.

        Output for Polygon.io Backtesting

        Conclusion

        By using Polygon.io’s comprehensive data and Lumibot’s robust backtesting framework, we can evaluate the effectiveness of a simple Buy-and-Hold strategy. Polygon.io’s minute-level data is particularly valuable for testing strategies that require more granularity than daily data, making it ideal for a wide range of strategies beyond just long-term investing.

        The Buy-and-Hold strategy is a great starting point for understanding backtesting, but you can build more complex strategies using Lumibot and Polygon.io data. Whether you are a beginner or an experienced algorithmic trader, this combination offers the tools and data needed to test and improve your strategies efficiently.

        Categories
        Algorithmic Trading

        Backtesting Strategies Using Yahoo Finance Data with Lumibot

        Introduction

        Backtesting is an essential part of algorithmic trading that allows traders to simulate a strategy’s performance using historical data. By testing strategies on past market conditions, traders can gain valuable insights into how their approach might behave in real-world scenarios without risking actual capital. One of the simplest yet effective long-term strategies is the Buy-and-Hold approach, where an investor purchases an asset and holds it regardless of market fluctuations. This strategy is favored by investors who believe in the long-term appreciation of the asset’s value.

        In this article, we will explore how to implement a Buy-and-Hold strategy using Lumibot, an algorithmic trading framework, and data from Yahoo Finance. Lumibot provides the infrastructure needed to test and deploy strategies, while Yahoo Finance offers a rich source of historical market data. We will backtest the strategy on the QQQ ETF, which tracks the performance of the Nasdaq 100 over a defined period to see how it performs compared to a benchmark like the S&P 500.

        Let’s read on to learn how to set up Lumibot, fetch historical data from Yahoo Finance, implement the strategy, and analyze its performance through backtesting. Whether you’re a beginner or an experienced trader, this guide will help you understand the basics of building and testing trading strategies using Python and Lumibot.

        Implementing the Buy-and-Hold Strategy Using Lumibot and Yahoo Finance Data

        In this section, we will break down the steps involved in implementing and backtesting a simple Buy-and-Hold strategy using Lumibot with Yahoo Finance data. This strategy buys a single asset (in this case, the QQQ ETF) and holds it throughout the entire backtest. We will explain the code, focusing on key components like the get_datetime() function, how to add data to indicator charts, and the backtesting logic.

        Strategy Breakdown

        The Buy-and-Hold strategy is one of the simplest trading strategies, where an asset is purchased and held over time without selling. Here, we are using Lumibot’s framework to automate this strategy, allowing it to buy the QQQ ETF once and hold it throughout the backtesting period. Below are the key steps and components of the code.

        from datetime import datetime
        from lumibot.strategies.strategy import Strategy
        
        """
        Strategy Description
        Simply buys one asset and holds onto it.
        """
        
        class BuyAndHold(Strategy):
            parameters = {
                "buy_symbol": "QQQ",
            }
        
            # =====Overloading lifecycle methods=============
            def initialize(self):
                # Set the sleep time to one day (the strategy will run once per day)
                self.sleeptime = "1D"
        
            def on_trading_iteration(self):
                """Buys the self.buy_symbol once, then never again"""
        
                # Get the current datetime and log it
                dt = self.get_datetime()  # Used to get the time in the backtesting environment
                self.log_message(f"Current datetime: {dt}")
        
                # Get the symbol to buy from the parameters
                buy_symbol = self.parameters["buy_symbol"]
        
                # Get the current value of the symbol and log it
                current_value = self.get_last_price(buy_symbol)
                self.log_message(f"The value of {buy_symbol} is {current_value}")
        
                # Add a line to the indicator chart
                self.add_line(f"{buy_symbol} Value", current_value)
        
                # Get all the positions that we have
                all_positions = self.get_positions()
        
                # If we don't own anything (other than USD), buy the asset
                if len(all_positions) <= 1:  # We always have a cash position (USD)
        
                    # Calculate the quantity to buy
                    quantity = int(self.portfolio_value // current_value)
        
                    # Create the order and submit it
                    purchase_order = self.create_order(buy_symbol, quantity, "buy")
                    self.submit_order(purchase_order)


        Key Components

        • dt = self.get_datetime(): This method fetches the current datetime within the backtesting environment, allowing the strategy to log or perform actions based on specific times. It’s especially useful when you need to align trades or actions with historical market events.
        • self.add_line(f”{buy_symbol} Value”, current_value): This line adds data to the indicator chart for tracking purposes. In this case, it logs the value of the asset (QQQ) over time, allowing you to visually monitor its price movements during the backtest.
        • all_positions = self.get_positions(): This retrieves all the positions currently held by the strategy. Since the strategy is designed to buy and hold only one asset (besides cash), we use this to check whether the asset is already in the portfolio. If not, the strategy will purchase it.

        Backtesting the Strategy

        The backtesting section of the code allows us to simulate how the strategy would have performed over a specific historical period using Yahoo Finance data. Backtesting is crucial to ensure the strategy’s viability without risking real capital.

        Backtesting the Strategy

        The backtesting section of the code allows us to simulate how the strategy would have performed over a specific historical period using Yahoo Finance data. Backtesting is crucial to ensure the strategy’s viability without risking real capital.

        if __name__ == "__main__":
            IS_BACKTESTING = True
        
            if IS_BACKTESTING:
                from lumibot.backtesting import YahooDataBacktesting
        
                # Backtest this strategy
                backtesting_start = datetime(2023, 1, 1)
                backtesting_end = datetime(2024, 9, 1)
        
                results = BuyAndHold.run_backtest(
                    YahooDataBacktesting,
                    backtesting_start,
                    backtesting_end,
                    benchmark_asset="SPY",
                )
        
                # Print the results
                print(results)
            else:
                ALPACA_CONFIG = {
                    "API_KEY": "YOUR_API_KEY",
                    "API_SECRET": "YOUR_API_SECRET",
                    "PAPER": True,
                }
        
                from lumibot.brokers import Alpaca
                from lumibot.traders import Trader
        
                trader = Trader()
                broker = Alpaca(ALPACA_CONFIG)
        
                strategy = BuyAndHold(broker=broker)
                trader.add_strategy(strategy)
                strategy_executors = trader.run_all()


        Key Points in the Backtesting Code

        • IS_BACKTESTING = True: This flag tells the script whether to run in backtesting mode or live trading mode. In backtesting mode, historical data is used to simulate trades. In live mode, the strategy would execute trades with a real broker.
        • Yahoo Finance Data: In backtesting, we use YahooDataBacktesting, which provides daily historical price data. Yahoo Finance supports daily data (not minute-level data), which is why we use a sleep time of 1D in the strategy to run once per day. This is perfect for long-term strategies like Buy-and-Hold, but not suitable for high-frequency or minute-based trading strategies.
        • Backtest Period: The strategy is tested between January 1, 2023, and September 1, 2024. During this period, the performance is compared against the S&P 500 benchmark (represented by the symbol SPY).

        Complete Code

        
        from datetime import datetime
         
        from lumibot.strategies.strategy import Strategy
         
        """
        Strategy Description
         
        Simply buys one asset and holds onto it.
        """
         
         
        class BuyAndHold(Strategy):
            parameters = {
                "buy_symbol": "QQQ",
            }
         
            # =====Overloading lifecycle methods=============
         
            def initialize(self):
                # Set the sleep time to one day (the strategy will run once per day)
                self.sleeptime = "1D"
         
            def on_trading_iteration(self):
                """Buys the self.buy_symbol once, then never again"""
         
                # Get the current datetime and log it
                dt = self.get_datetime() # We use this function so that we get the time in teh backtesting environment
                self.log_message(f"Current datetime: {dt}")
         
                # Get the symbol to buy from the parameters
                buy_symbol = self.parameters["buy_symbol"]
         
                # Get the current value of the symbol and log it
                current_value = self.get_last_price(buy_symbol)
                self.log_message(f"The value of {buy_symbol} is {current_value}")
         
                # Add a line to the indicator chart
                self.add_line(f"{buy_symbol} Value", current_value)
         
                # Get all the positions that we have
                all_positions = self.get_positions()
         
                # If we don't own anything (other than USD), buy the asset
                if len(all_positions) <= 1:  # Because we always have a cash position (USD)
         
                    # Calculate the quantity to buy
                    quantity = int(self.portfolio_value // current_value)
         
                    # Create the order and submit it
                    purchase_order = self.create_order(buy_symbol, quantity, "buy")
                    self.submit_order(purchase_order)
         
         
        if __name__ == "__main__":
            IS_BACKTESTING = True
         
            if IS_BACKTESTING:
                from lumibot.backtesting import YahooDataBacktesting
         
                # Backtest this strategy
                backtesting_start = datetime(2023, 1, 1)
                backtesting_end = datetime(2024, 9, 1)
         
                results = BuyAndHold.run_backtest(
                    YahooDataBacktesting,
                    backtesting_start,
                    backtesting_end,
                    benchmark_asset="SPY",
                )
         
                # Print the results
                print(results)
            else:
                ALPACA_CONFIG = {
                    "API_KEY": "YOUR_API_KEY",
                    "API_SECRET": "YOUR_API_SECRET",
                    "PAPER": True,
                }
         
                from lumibot.brokers import Alpaca
                from lumibot.traders import Trader
         
                trader = Trader()
         
                broker = Alpaca(ALPACA_CONFIG)
         
                strategy = BuyAndHold(broker=broker)
         
                trader.add_strategy(strategy)
                strategy_executors = trader.run_all()


        Output Files and Key Metrics Explained: Tearsheet, Indicators, and Trades

        When backtesting a strategy using Lumibot, the results are compiled into several detailed output files. These files help traders analyze the performance of their strategy, both in terms of profitability and risk. Below is an explanation of the key output files—tearsheet.html, indicators.html/csv, and trades.html/csv—along with an in-depth look at important metrics commonly found in the tearsheet.

        1. Tearsheet.html / Tearsheet.csv

        The tearsheet is the primary report generated from a backtest, summarizing the strategy’s overall performance across various dimensions. It contains critical metrics that give insight into returns, risk, and consistency. Let’s break down some of the key metrics:

        Key Performance Metrics in Tearsheet:

        • Risk-Free Rate:
          • The theoretical return on an investment with zero risk, often based on government bond yields. This is used to calculate risk-adjusted metrics like the Sharpe and Sortino Ratios.
        • Time in Market:
          • The percentage of time that the strategy was actively holding a position in the market during the backtest period. This shows how much of the time the strategy had exposure to the market.
        • Total Return:
          • The overall return the strategy achieved over the entire backtest period. It’s a simple percentage that represents how much your portfolio grew from start to finish.
        • CAGR (Compound Annual Growth Rate) %:
          • The average annual growth rate of the investment over the backtesting period, assuming the profits are reinvested each year. It gives a clearer picture of the strategy’s long-term growth potential.
        • ROMAD (Return Over Maximum Drawdown):
          • A performance metric that measures the return earned per unit of maximum drawdown (the worst drop in portfolio value). A higher ROMAD indicates better performance relative to the strategy’s worst downturn.
        • Correlation to Benchmark:
          • This metric shows how closely the strategy’s returns are correlated to the benchmark index (e.g., S&P 500). A correlation closer to 1 means the strategy moves similarly to the benchmark, while a value closer to 0 means the strategy behaves independently.
        • Sortino Ratio:
          • A risk-adjusted return metric that focuses only on downside risk (negative volatility). It is similar to the Sharpe Ratio but penalizes only those returns that fall below a specific threshold (usually the risk-free rate).
        • Max Drawdown:
          • The largest peak-to-trough decline in portfolio value during the backtesting period. It shows the most significant loss the strategy experienced and is crucial for assessing risk tolerance.
        • Maximum Drawdown Days:
          • The number of days it took for the strategy to recover from its maximum drawdown. This shows how long the portfolio was underwater before it reached its previous peak.
        • Minimum Volatility:
          • The lowest level of volatility (price fluctuation) experienced by the strategy during the backtest period. Lower volatility generally indicates a smoother, less risky strategy.

        Win/Loss Metrics:

        These metrics help assess how often the strategy outperforms over different timeframes:

        • Win Days %:
          • The percentage of days where the strategy generated a positive return. This metric helps evaluate the consistency of the strategy on a day-to-day basis.
        • Win Months %:
          • The percentage of months where the strategy was profitable. This gives insight into the strategy’s long-term consistency.
        • Win Quarters %:
          • The percentage of quarters where the strategy showed gains. Winning in most quarters indicates strong and consistent performance.
        • Win Years %:
          • The percentage of years where the strategy was profitable. A high win percentage over years indicates a robust long-term strategy.

        Below is the tearsheet.html  for the above code:

        2. Indicators.html / Indicators.csv

        The indicators file records various technical indicators used in the strategy during the backtest. These indicators help you track how market conditions evolved and how your strategy responded based on predefined rules. The data is typically logged at each time step (daily, weekly, etc.), providing a clear view of the key metrics that influence trading decisions.

        Key Contents of Indicators File:

        • Indicator Values Over Time:
          • This might include moving averages, RSI, MACD, Bollinger Bands, or other indicators the strategy uses. You can see how these values fluctuate over time and correlate to the strategy’s buy/sell actions.
        • Custom Strategy Metrics:
          • If the strategy logs custom values (like portfolio value, cash position, or specific thresholds), they will also appear in this file.

        Below is the indicator.html  file for the above code:

        This file is particularly helpful for understanding how the strategy reacts to changing market conditions and whether the signals generated by indicators are being used effectively.

        3. Trades.html / Trades.csv

        The trades file records every trade executed by the strategy during the backtest. This detailed log helps you analyze each transaction to see if the strategy performed as expected. It provides transparency into when and why trades were made.

        Key Contents of Trades File:

        • Trade Timestamp:
          • The date and time when each trade was executed.
        • Symbol:
          • The asset being traded (e.g., QQQ).
        • Buy/Sell Action:
          • Indicates whether the trade was a buy or sell order.
        • Trade Price:
          • The price at which the asset was bought or sold.
        • Quantity:
          • The number of units (e.g., shares or contracts) involved in the trade.
        • Profit/Loss:
          • The resulting profit or loss from each trade. This helps you identify which trades were successful and which weren’t.
        • Order Type:
          • Whether the order was a market, limit, or other type of order.

        Below is the traders.html file for the above code:

        This file allows you to do a deep dive into the mechanics of the strategy. By reviewing the trades, you can verify that the strategy was executing properly, and identify patterns in profitable and unprofitable trades.

        Conclusion

        This strategy and backtest allow us to evaluate how a simple Buy-and-Hold approach performs over time using Lumibot and Yahoo Finance data. While the strategy only buys one asset and holds it, backtesting on historical data provides crucial insights into its performance against benchmarks like the S&P 500.

        By leveraging Lumibot, you can further customize this strategy or explore more complex trading strategies. Yahoo Finance data works best for daily strategies, making it ideal for long-term investments rather than short-term or high-frequency trades.

        Categories
        Algorithmic Trading

        Technical Analysis Using Bollinger Bands and Lumibot

        Introduction 

        Many technical analysis challenges, such as identifying market trends and determining entry or exit points, can be effectively addressed using Bollinger Bands in a trading bot. Bollinger Bands helps solve these issues by providing a dynamic range around the price that signals overbought or oversold conditions, making it easier for a trading bot to make informed decisions. With the rise of automated trading platforms like Lumibot, traders can seamlessly integrate Bollinger Bands into their bots for real-time technical analysis. Lumibot’s user-friendly interface and robust API make it a perfect tool for implementing Bollinger Bands strategies in an automated trading setup.

        Furthermore, Lumibot empowers traders to customize their Bollinger Bands parameters, such as period length and deviation settings, based on market conditions and trading objectives. This flexibility enhances a bot’s ability to react swiftly to market fluctuations, improving overall trading efficiency. Lumibot’s extensive backtesting capabilities also allow traders to refine their Bollinger Bands strategies by testing them on historical data.

        How Bollinger Bands Can Be Used for Technical Analysis of an Asset: Bollinger Bands provide crucial insights into market volatility and potential price reversals, making them a valuable tool for analyzing any asset. By observing how an asset’s price behaves relative to the upper and lower bands, traders can gauge whether the asset is overbought or oversold. This helps in formulating strategies for when to enter or exit trades based on clear market signals.

        Read on to find the nitty-gritty of how Bollinger Bands can be effectively incorporated into a trading bot for technical analysis of an asset.

        Using Bollinger Bands in a Trading Bot for Technical Analysis

        Bollinger Bands are widely used in trading strategies due to their ability to highlight market volatility, overbought/oversold levels, and potential price reversals. By incorporating Bollinger Bands into a trading bot, traders can automate decisions and capitalize on these insights. Below are five ways Bollinger Bands can be utilized in a trading bot for technical analysis, with a breakdown of what each method is and how it can be applied effectively in an automated trading system.

        1. Identifying Overbought and Oversold Conditions

        What It Is:

        Bollinger Bands help determine whether an asset is overbought (price touching or exceeding the upper band) or oversold (price touching or dropping below the lower band). These conditions often signal a potential price reversal.

        How It Can Be Used in a Trading Bot:

        In a trading bot, Bollinger Bands can be programmed to trigger buy signals when the price hits the lower band (oversold) and sell signals when it hits the upper band (overbought). This allows the bot to make decisions based on predefined criteria without human intervention.

        2. Volatility Breakouts (The Squeeze)

        What It Is:

        When the bands contract (i.e., when they come close together), it indicates reduced volatility, commonly referred to as “the squeeze.” This phase is often followed by a volatility breakout, where the price sharply moves in either direction.

        How It Can Be Used in a Trading Bot:

        Traders can configure a bot to monitor for contractions in Bollinger Bands. Once the bands start expanding, the bot can place orders based on the direction of the breakout (up or down). The bot can also be set to place stop-losses to manage risk in case of a false breakout.

        3. Mean Reversion Strategy

        What It Is:

        Bollinger Bands are centered around a moving average, which acts as a benchmark for the “fair” price of the asset. When the price moves too far from this average (toward either band), it often reverts back to the mean.

        How It Can Be Used in a Trading Bot:

        A trading bot can be programmed to execute trades when the price moves away from the moving average toward the bands and then place opposing trades (sell or buy) when the price reverts back to the mean. This strategy works well in range-bound markets.

        4. Trend Following with Bollinger Bands

        What It Is:

        In a strong trend, the price tends to hug one of the Bollinger Bands. In an uptrend, the price often stays near the upper band, while in a downtrend, it stays near the lower band.

        How It Can Be Used in a Trading Bot:

        A trading bot can be designed to open positions following the trend direction. For example, if the price is consistently hitting the upper band, the bot can place buy orders. Conversely, if the price sticks to the lower band, the bot can open sell positions, adjusting stop-losses and profit-taking points accordingly.

        5. Detecting Double Tops and Bottoms

        What It Is:

        Bollinger Bands can help detect double tops (two peaks near the upper band signaling a potential bearish reversal) or double bottoms (two troughs near the lower band indicating a bullish reversal).

        How It Can Be Used in a Trading Bot:

        Bots can be configured to recognize these patterns and automatically trigger trades when they form. For example, a bot can be set to initiate a sell order after identifying a double top or a buy order after spotting a double bottom. This pattern recognition can be enhanced by combining Bollinger Bands with other indicators for better accuracy.

        By incorporating these strategies, traders can enhance their trading bot’s performance and create systems that are responsive to market conditions, taking full advantage of Bollinger Bands for technical analysis.

        Steps to Get the Bollinger Bands of the Historical Price of an Asset with Lumibot

        Prerequisites

        Must have Python installed in the system(version 3.10 or above)

        1. Install required Python packages.
        
         pip install lumibot
        

        2. Necessary imports for running the Python file.

        
        from lumibot.strategies import Strategy
        import pandas_ta as ta


        3. Create ALPACA_CONFIG with API KEY and API SECRET by logging in or signing up at https://alpaca.markets/.

        Steps for Using Bollinger Bands of the Historical Price of an Asset

        Step 1: Add ALPACA_CONFIG Details

        Alpaca is a broker, just like the interactive broker. The details below are required to use the Alpaca broker API.

        ALPACA_CONFIG = {
        	"API_KEY": "YOUR_API_KEY_HERE", # Get your API Key from https://alpaca.markets/
        	"API_SECRET": "YOUR_SECRET_HERE", # Get your secret from https://alpaca.markets/
        	"PAPER":True # Set to False for real money
        }


        Step 2: Create a GetHistoricalPrice Class 

        Once you have added the Alpaca config detail, create a GetHistoricalPrice class, which will inherit the Strategy class as below.

        class GetHistoricalPrice(Strategy):
        

        Step 3: Add  on_trading_iteration() Method 

        Once you have added the initialize method, follow with the creation of  on_trading_iteration() method as below:

        def on_trading_iteration(self):
        
           	# Get historical prices for AAPL
               bars = self.get_historical_prices("AAPL", 30, "day")
               df = bars.df
        
           	# Calculate Bollinger Bands
               bbands = ta.bbands(df['close'], length=20, std=2)
               df['BB_Middle'] = bbands['BBM_20_2.0']
               df['BB_Upper'] = bbands['BBU_20_2.0']
               df['BB_Lower'] = bbands['BBL_20_2.0']
        
           	# Drop any rows with NaN values
               df.dropna(inplace=True)
        
           	print(df[['close', 'BB_Middle', 'BB_Upper', 'BB_Lower']])
        

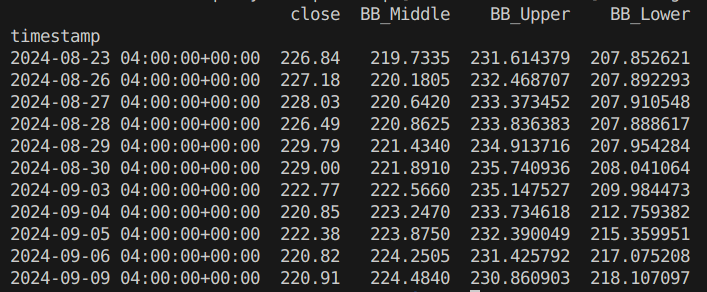
        In this code, the function on_trading_iteration retrieves historical price data for Apple Inc. (“AAPL”) over the last 30 days, with each data point representing a day. It then calculates the Bollinger Bands for the closing prices of AAPL using a 20-day moving average and 2 standard deviations. The calculated Bollinger Bands consist of three lines: the middle band (20-day moving average), upper band (2 standard deviations above the middle), and lower band (2 standard deviations below the middle). These values are added to the dataframe df as new columns. Afterward, any rows containing missing values (NaN) are removed, and the relevant columns (close price, middle, upper, and lower Bollinger Bands) are printed to the console for analysis.

        Note 1: Running the Code in the Same File 

        In Python, if __name__ == “__main__”: is a conditional statement, which allows you to control the execution of code depending on whether the script is run directly or imported as a module. This implies that the code will run only if runs as a script and not as a module. 

        if __name__ == "__main__": 


        Step 4: Import Alpaca and Trader 

        Import Alpaca and Trader classes from Lumibot.brokers and Lumibot.traders modules. While Alpaca is an interface to the Alpaca trading platform, it leverages us with the functionalities to interact with the Alpaca API for implementing things like placing orders, managing positions, and fetching market data like Historical Price Data, which we are doing in this blog.

        The Trader class helps orchestrate the trading process, managing multiple trading strategies, interacting with brokers like Alpaca, Interactive Brokers, and Tradiers, handling order execution and position management, and ensuring a framework for live trading and backtesting. 

        from lumibot.brokers import Alpaca
        from lumibot.traders import Trader


        Step 5: Create Trader Class Object

        As you import the Alpaca and Trader class, create the trader object of the Trader() class.

         trader = Trader()
        

        Step 6: Create an Object of Alpaca Class

        On creation of the trader class object, create the object of the Alpaca class by passing the Alpaca_Config array created above.

        broker = Alpaca(ALPACA_CONFIG)
        

        Step 7: Create an Object of GetHistoricalPrice Class

        Once we have created the object for the Alpaca class, we will create an object of the GetHistoricalPrice class by passing the Alpaca object (broker) as a parameter to the GetHistoricalPrice class. 

         strategy = GetHistoricalPrice(broker=broker)


        Step 8: Pass the Strategy to the Trader Class Object

        On creation of the object of the GetHistoricalPrice class, add the strategy to the trader class object using the add_strategy() method.

        trader.add_strategy(strategy)
        

        Step 9: Start the Overall Trading Process

        The code below starts the overall trading process. This typically executes backtesting or a live trading process for a collection of strategies within a trading platform. This command starts the execution engine. It establishes the connection with a broker, which is Alpaca, and starts background tasks like market data ingestion and order management. Briefly, it is the starting point of the trading process.

        trader.run_all()


        Complete Code

        from lumibot.strategies import Strategy
        import pandas_ta as ta
        
        # Alpaca API configuration
        ALPACA_CONFIG = {
            "API_KEY": "YOUR_API_KEY_HERE", # Get your API Key from https://alpaca.markets/
            "API_SECRET": "YOUR_SECRET_HERE", # Get your secret from https://alpaca.markets/
            "PAPER":True # Set to False for real money
        }
        class GetHistoricalPrice(Strategy):
        
           def on_trading_iteration(self):
        
           	# Get historical prices for AAPL
               bars = self.get_historical_prices("AAPL", 30, "day")
               df = bars.df
        
           	# Calculate Bollinger Bands
               bbands = ta.bbands(df['close'], length=20, std=2)
               df['BB_Middle'] = bbands['BBM_20_2.0']
               df['BB_Upper'] = bbands['BBU_20_2.0']
               df['BB_Lower'] = bbands['BBL_20_2.0']
        
           	# Drop any rows with NaN values
               df.dropna(inplace=True)
        
           	print(df[['close', 'BB_Middle', 'BB_Upper', 'BB_Lower']])
        
        
        if __name__ == "__main__":
        
           from lumibot.brokers import Alpaca
           from lumibot.traders import Trader
        
           broker = Alpaca(ALPACA_CONFIG)
           strategy = GetHistoricalPrice(broker=broker)
          
           trader = Trader()
           trader.add_strategy(strategy)
           trader.run_all()
        

        Output

        Conclusion

        Bollinger Bands provides traders with a clear framework for analyzing market trends, detecting overbought and oversold conditions, and identifying potential breakouts. When integrated into a trading bot, Bollinger Bands can automate these insights, helping traders execute strategies with precision and without emotional bias. Tools like Lumibot simplify this automation, enabling traders to fine-tune their Bollinger Bands parameters backtest strategies and set up fully autonomous trading systems based on real-time market conditions.

        By leveraging Lumibot’s advanced features, traders can unlock the full potential of Bollinger Bands, increasing their chances of success in a dynamic market environment.

        Take Your Trading to the Next Level with Lumibot

        Ready to harness the power of Bollinger Bands and automate your trading strategies? Lumibot offers the perfect platform to build, customize, and optimize your trading bot. Whether you’re new to automated trading or a seasoned professional, Lumibot provides intuitive tools to help you stay ahead of the market.

        Sign up for Lumibot today and start integrating Bollinger Bands into your trading bot for a more efficient, data-driven trading experience!

        Categories
        Algorithmic Trading

        Technical Analysis Using MACD and Lumibot

        Introduction

        Are you struggling to optimize your trading bot’s performance? MACD, or Moving Average Convergence Divergence, can be a powerful tool to help you address common challenges in automated trading. By identifying potential trend reversals, overbought or oversold conditions, and generating trading signals, MACD can provide valuable insights for your bot’s decision-making process.
        Lumibot, a leading trading bot platform, offers seamless integration with MACD, allowing you to leverage its capabilities to enhance your trading strategies. With Lumibot, you can easily incorporate MACD into your bot’s logic, making informed decisions based on real-time market data.
        Let’s read on to find out how to effectively use MACD in your trading bot.

        Five Applications of MACD in Trading Bots

        MACD, a versatile technical indicator, offers a wealth of insights for traders. Let’s read on to explore five key applications that can help you make informed decisions and enhance your trading strategies.

        1. Trend Reversal Detection

        • Bullish Crossovers: When the MACD line crosses above the signal line, it suggests a potential uptrend reversal. A trading bot can be programmed to automatically initiate long positions when this occurs.
        • Bearish Crossovers: When the MACD line crosses below the signal line, it suggests a potential downtrend reversal. A trading bot can be programmed to automatically initiate short positions or close existing long positions based on this signal.

        2. Overbought/Oversold Indicators

        • Positive Histogram: A significantly positive MACD histogram indicates that the asset may be overbought, suggesting a potential pullback or correction. A trading bot can be programmed to reduce existing long positions or avoid entering new long positions when the histogram reaches a predetermined threshold.
        • Negative Histogram: A significantly negative MACD histogram indicates that the asset may be oversold, suggesting a potential rebound. A trading bot can be programmed to initiate long positions or reduce existing short positions based on this signal.

        3. Divergence Detection

        • Positive Divergence: When the price makes a new low, but the MACD fails to make a new low (positive divergence), it can signal a potential bullish reversal. A trading bot can be programmed to automatically initiate long positions or reduce existing short positions based on this divergence.
        • Negative Divergence: When the price makes a new high, but the MACD fails to make a new high (negative divergence), it can signal a potential bearish reversal. A trading bot can be programmed to automatically initiate short positions or reduce existing long positions based on this divergence.

        4. Momentum Confirmation

        • Upward Sloping MACD: When the MACD line is above the signal line and moving upward, it confirms an uptrend. A trading bot can be programmed to maintain or increase existing long positions based on this signal.
        • Downward Sloping MACD: When the MACD line is below the signal line and moving downward, it confirms a downtrend. A trading bot can be programmed to maintain or increase existing short positions based on this signal.

        5. Trading Strategy Development

        • Combination with Other Indicators: MACD can be combined with other technical indicators, such as RSI, Bollinger Bands, or support and resistance levels, to develop more complex trading strategies. A trading bot can be programmed to execute trades based on a combination of these indicators.
        • Backtesting and Optimization: Traders can backtest their MACD-based trading strategies using historical data to evaluate their performance and optimize parameters like the fast and slow EMAs and the signal line period. A trading bot can be programmed to continuously backtest and optimize its trading strategy based on historical data.

        Risk Management: To mitigate potential losses, it’s essential to incorporate risk management techniques, such as stop-loss orders and position sizing when using MACD in trading bots. A trading bot can be programmed to automatically implement stop-loss orders and adjust position sizes based on predefined criteria.

        Steps To Get the MACD(Moving Average Convergence Divergence) of the Historical Price of an Asset with Lumibot

        Prerequisites

        Must have Python installed in the system(version 3.10 or above)

        1. Install required Python packages.
        
         pip install lumibot


        2. Necessary imports for running the Python file.

        
        from lumibot.strategies import Strategy
        

        3. Create ALPACA_CONFIG with API KEY and API SECRET by logging in or signing up at https://alpaca.markets/

        Steps To Get the MACD (Moving Average Convergence Divergence) of an Asset with Lumibot

        Step 1: Add ALPACA_CONFIG Details

        Alpaca is a broker, just like the interactive broker. The details below are required to use the Alpaca broker API.

        ALPACA_CONFIG = {
        	"API_KEY": "YOUR_API_KEY_HERE", # Get your API Key from https://alpaca.markets/
        	"API_SECRET": "YOUR_SECRET_HERE", # Get your secret from https://alpaca.markets/
        	"PAPER":True # Set to False for real money
        }
        

        Step 2: Create a GetHistoricalPrice Class 

        Once you have added the Alpaca config detail, create a GetHistoricalPrice class, which will inherit the Strategy class as below.

        class GetHistoricalPrice(Strategy):
        

        Step 3: Add on_trading_iteration() Method

        Once you have added the initialize method, follow with the creation of  on_trading_iteration() method as below:

           def on_trading_iteration(self):
        
                bars = self.get_historical_prices("AAPL", 50, "day")  # Ensure enough data for MACD
                df = bars.df
        
                # Calculate MACD values
                macd = ta.macd(df['close'])
                df['MACD'] = macd['MACD_12_26_9']
                df['MACD_Signal'] = macd['MACDs_12_26_9']
                df['MACD_Hist'] = macd['MACDh_12_26_9']
        
                # Drop any rows with NaN values that could cause errors
                df.dropna(inplace=True)
        
                print(df)


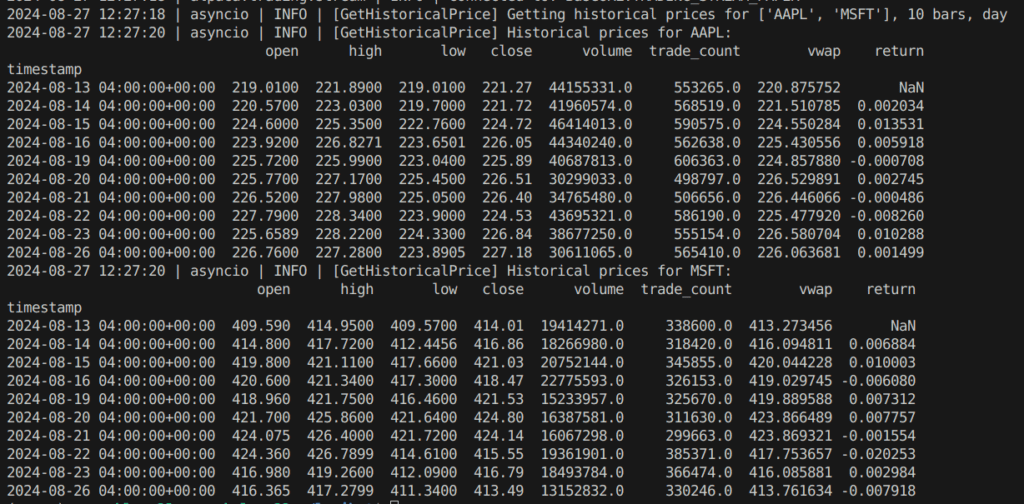
        The provided code calculates the MACD values for Apple stock based on historical price data. It first fetches the necessary data, creates a DataFrame, and then uses the ta.macd function to calculate the MACD line, signal line, and histogram. Finally, it removes any rows with missing values and prints the resulting DataFrame for inspection. This DataFrame can be used for further analysis or to generate trading signals based on the calculated MACD values.

        Note 1: Running the Code in the Same File 

        In Python, if __name__ == “__main__”: is a conditional statement, which allows you to control the execution of code depending on whether the script is run directly or imported as a module. This implies that the code will run only if runs as a script and not as a module. 

        if __name__ == "__main__": 


        Step 4: Import Alpaca and Trader 

        Import Alpaca and Trader classes from Lumibot.brokers and Lumibot.traders modules. While Alpaca is an interface to the Alpaca trading platform, it leverages us with the functionalities to interact with the Alpaca API for implementing things like placing orders, managing positions, and fetching market data like Historical Price Data, which we are doing in this blog.

        The Trader class helps orchestrate the trading process, managing multiple trading strategies, interacting with brokers like Alpaca, Interactive Brokers, and Tradiers, handling order execution and position management, and ensuring a framework for live trading and backtesting. 

        from lumibot.brokers import Alpaca
        from lumibot.traders import Trader


        Step 5: Create Trader Class Object

        As you import the Alpaca and Trader class, create the trader object of the Trader() class.

         trader = Trader()
        

        Step 6: Create an Object of Alpaca Class

        On creation of the trader class object, create the object of the Alpaca class by passing the Alpaca_Config array created above.

        broker = Alpaca(ALPACA_CONFIG)
        

        Step 7: Create an Object of GetHistoricalPrice Class

        Once we have created the object for the Alpaca class, we will create an object of the GetHistoricalPrice class by passing the Alpaca object (broker) as a parameter to the GetHistoricalPrice class. 

         strategy = GetHistoricalPrice(broker=broker)
        

        Step 8: Pass the Strategy to the Trader Class Object

        On creation of the object of the GetHistoricalPrice class, add the strategy to the trader class object using the add_strategy() method.

        trader.add_strategy(strategy)
        

        Step 9: Start the Overall Trading Process

        The code below starts the overall trading process. This typically executes backtesting or a live trading process for a collection of strategies within a trading platform. This command starts the execution engine. It establishes the connection with a broker, which is Alpaca, and starts background tasks like market data ingestion and order management. Briefly, it is the starting point of the trading process.

        trader.run_all()
        

        Complete Code

        Below is the entire code. Simply paste the code below in a gethistprice.py file, add the Alpaca API and secret keys, install the prerequisites, and run the code. However, ensure the market is open, which applies to US markets. The pre-trading hours start at 4 a.m. and end at 9:30 a.m. The regular trading hours begin at 9:30 a.m. and end at 4 p.m., and the after-trading hours last from 4 p.m. to 8 p.m. All timings are in Eastern Time (ET). Run the below code during regular trading hours.

        from lumibot.strategies import Strategy
        import pandas_ta as ta
        
        # Alpaca API configuration
        ALPACA_CONFIG = {
            "API_KEY": "YOUR_API_KEY_HERE", # Get your API Key from
        https://alpaca.markets/
            "API_SECRET": "YOUR_SECRET_HERE", # Get your secret from
        https://alpaca.markets/
            "PAPER":True # Set to False for real money
        }
        class GetHistoricalPrice(Strategy):
        
            def on_trading_iteration(self):
        
                bars = self.get_historical_prices("AAPL", 50, "day")  # Ensure enough data for MACD
                df = bars.df
        
                # Calculate MACD values
                macd = ta.macd(df['close'])
                df['MACD'] = macd['MACD_12_26_9']
                df['MACD_Signal'] = macd['MACDs_12_26_9']
                df['MACD_Hist'] = macd['MACDh_12_26_9']
        
                # Drop any rows with NaN values that could cause errors
                df.dropna(inplace=True)
        
                print(df)
        
        
        if __name__ == "__main__":
        
            from lumibot.brokers import Alpaca
            from lumibot.traders import Trader
        
            broker = Alpaca(ALPACA_CONFIG)
            strategy = GetHistoricalPrice(broker=broker)
            
            trader = Trader()
            trader.add_strategy(strategy)
            trader.run_all()

        Output

        Conclusion

        By effectively integrating MACD into a trading bot, traders can automate their trading strategies and improve their trading results. However, it’s important to note that no trading strategy is foolproof, and it’s essential to conduct thorough backtesting and risk management to minimize losses. Ready to leverage the power of MACD and other technical indicators in your trading bot? Lumibot offers a robust platform with easy-to-use APIs and comprehensive documentation to help you build and deploy sophisticated trading strategies. Start your journey towards automated trading success with Lumibot today!


        Categories
        Algorithmic Trading

        Technical Analysis of Asset: An RSI Approach Using Lumibot

        Introduction

        In the dynamic world of financial markets, where trends can shift rapidly, trading bots have become an invaluable tool for investors seeking to capitalize on opportunities. To create a truly effective trading bot, it’s essential to equip it with powerful analytical tools. One such tool is the Relative Strength Index (RSI), a popular technical indicator that measures the speed and change of price movements.

        To incorporate RSI into your trading bot’s strategy, consider using a robust tool like Lumibot, a comprehensive Python library. Lumibot offers exceptional capabilities for retrieving historical price data, calculating technical indicators, and integrating them into your trading strategies. By leveraging Lumibot’s powerful features, you can build a smarter, more profitable trading bot that can effectively harness the insights provided by the RSI.

        RSI: A Powerful Tool for Algorithmic Trading

        The Relative Strength Index (RSI) is a versatile technical indicator that can be used to create various trading strategies. Here are five pointers on how to incorporate RSI into your trading bot:

        1. Overbought and Oversold Signals:

        • Identifying Extreme Conditions: When the RSI reaches extreme levels (e.g., above 70 or below 30), it might indicate an overbought or oversold condition.
        • Trading Signals: Your trading bot can use these signals to initiate sell orders when the RSI is overbought and buy orders when the RSI is oversold. For instance, if the RSI reaches 80, the bot might automatically sell the asset, assuming it is overvalued.

        2. Divergence:

        • Identifying Divergence: Divergence occurs when the price and the RSI move in opposite directions. For example, if the price is making new highs, but the RSI is making new lows, it might suggest a potential reversal.

        Trading Signals: Your trading bot can identify potential trend changes with divergence signals. For instance, if the price is making new highs, but the RSI fails to make new highs, it might indicate a bearish divergence, suggesting a potential downtrend.

        3. Combining with Other Indicators:

        • Enhanced Signal Reliability: Combining RSI with other technical indicators can help improve trading signals’ accuracy and reliability.

        Example: Combining RSI with the Simple Moving Average (SMA) can provide a more comprehensive analysis. For instance, if the price is above the SMA and the RSI is near the overbought level, it might suggest a potential sell signal, indicating that the asset is overvalued and the uptrend might be nearing its end.

        4. Backtesting:

        • Evaluating Strategy Performance: Backtesting involves testing your trading strategy on historical data to assess its performance.
        • Identifying Improvements: By backtesting, you can identify potential weaknesses in your strategy and make necessary adjustments.

        Example: You can backtest an RSI-based trading strategy using historical data for a specific asset to determine its profitability and risk exposure.

        5. Risk Management:

        • Protecting Investments: Implementing risk management strategies is essential to protect your investments from excessive losses.
        • Stop-Loss Orders: Set stop-loss orders to automatically sell the asset if the price is predetermined, limiting potential losses.
        • Take-Profit Orders: Set take-profit orders to automatically sell the asset when it reaches a predetermined profit target, securing your gains.
        • Position Sizing: Carefully manage your position size to avoid excessive risk. Consider factors such as your risk tolerance and the asset’s volatility.

        By incorporating these pointers into your trading bot, you can effectively leverage the RSI to make informed trading decisions and improve investment outcomes.

        Steps To Get the Relative Strength Index (RSI) of the Historical Price of an Asset with Lumibot

        Prerequisites

        Must have Python installed in the system(version 3.10 or above)

        1. Install required Python packages.
        pip install lumibot
        

        2. Necessary imports for running the Python file.

        
        from lumibot.strategies import Strategy
        import pandas_ta as ta


        3. Create ALPACA_CONFIG with API KEY and API SECRET by logging in or signing up at https://alpaca.markets/

        Steps for Using Relative Strength Index (RSI) of the Historical Price of an Asset

        Step 1: Add ALPACA_CONFIG Details

        Alpaca is a broker, just like the interactive broker. The details below are required to use the Alpaca broker API.

        ALPACA_CONFIG = {
            "API_KEY": "YOUR_API_KEY_HERE", # Get your API Key from
        https://alpaca.markets/
            "API_SECRET": "YOUR_SECRET_HERE", # Get your secret from
        https://alpaca.markets/
            "PAPER":True # Set to False for real money
        }

        Step 2: Create a GetHistoricalPrice Class 

        Once you have added the Alpaca config detail, create a GetHistoricalPrice class, which will inherit the Strategy class as below.

        class GetHistoricalPrice(Strategy):
        

        Step 3: Add  on_trading_iteration() Method 

        Once you have added the initialize method, follow with the creation of  on_trading_iteration() method as below:

        def on_trading_iteration(self):
        
                # Retrieve historical price data for AAPL
                bars = self.get_historical_prices("AAPL", 10, "day")
                df = bars.df
        
        
                df['RSI_10'] = ta.rsi(df['close'], length=9)
        
                print(df)
        

        The provided code snippet defines a function that retrieves historical price data for AAPL, calculates a 10-day Relative Strength Index (RSI), and prints the resulting data frame. This function could be used in various algorithmic trading scenarios, such as trend following, mean reversion, backtesting, or real-time trading. By incorporating this function into a larger trading system, you can leverage the power of technical analysis to make data-driven trading decisions.

        Note 1: Running the Code in the Same File 

        In Python, if __name__ == “__main__”: is a conditional statement, which allows you to control the execution of code depending on whether the script is run directly or imported as a module. This implies that the code will run only if runs as a script and not as a module. 

        if __name__ == "__main__": 

        Step 4: Import Alpaca and Trader

        Import Alpaca and Trader classes from Lumibot.brokers and Lumibot.traders modules. While Alpaca is an interface to the Alpaca trading platform, it leverages us with the functionalities to interact with the Alpaca API for implementing things like placing orders, managing positions, and fetching market data like Historical Price Data, which we are doing in this blog.

        The Trader class helps orchestrate the trading process, managing multiple trading strategies, interacting with brokers like Alpaca, Interactive Brokers, and Tradiers, handling order execution and position management, and ensuring a framework for live trading and backtesting. 

        from lumibot.brokers import Alpaca
        from lumibot.traders import Trader
        

        Step 5: Create Trader Class Object

        As you import the Alpaca and Trader class, create the trader object of the Trader() class.

          trader = Trader()
        

        Step 6: Create an Object of Alpaca Class

        On creation of the trader class object, create the object of the Alpaca class by passing the Alpaca_Config array created above.

         broker = Alpaca(ALPACA_CONFIG)


        Step 7: Create an Object of GetHistoricalPrice Class

        Once we have created the object for the Alpaca class, we will create an object of the GetHistoricalPrice class by passing the Alpaca object (broker) as a parameter to the GetHistoricalPrice class. 

         strategy = GetHistoricalPrice(broker=broker)


        Step 8: Pass the Strategy to the Trader Class Object

        On creation of the object of the GetHistoricalPrice class, add the strategy to the trader class object using the add_strategy() method.

        trader.add_strategy(strategy)


        Step 9: Start the Overall Trading Process

        The code below starts the overall trading process. This typically executes backtesting or a live trading process for a collection of strategies within a trading platform. This command starts the execution engine. It establishes the connection with a broker, which is Alpaca, and starts background tasks like market data ingestion and order management. Briefly, it is the starting point of the trading process.

        trader.run_all()

        Complete Code

        from lumibot.strategies import Strategy
        import pandas_ta as ta
        
        ALPACA_CONFIG = {
            "API_KEY": "",
            "API_SECRET": "",
            "PAPER": True
        }
        
        class GetHistoricalPrice(Strategy):
        
            def on_trading_iteration(self):
        
                # Retrieve historical price data for AAPL
                bars = self.get_historical_prices("AAPL", 10, "day")
                df = bars.df
        
        
                df['RSI_10'] = ta.rsi(df['close'], length=9)
        
                print(df)
        
        if __name__ == "__main__":
        
            from lumibot.brokers import Alpaca
            from lumibot.traders import Trader
        
            trader = Trader()
            broker = Alpaca(ALPACA_CONFIG)
            strategy = GetHistoricalPrice(broker=broker)
            trader.add_strategy(strategy)
            trader.run_all()


        Output

        Conclusion

        The Relative Strength Index (RSI) is a valuable technical indicator that can help you identify overbought or oversold conditions and potential trend reversals. By using Lumibot, you can easily retrieve historical price data, calculate RSI, and develop effective trading strategies. Combine RSI with other indicators and backtest your strategies to optimize their performance. Start your algorithmic trading journey today and unlock the power of RSI with Lumibot. By leveraging Lumibot’s features, you can streamline the process of using RSI in your trading strategies and make data-driven investment decisions.

        Categories
        Algorithmic Trading

        How to Get the Simple Moving Average of the Historical Price of an Asset with Lumibot

        .

        Introduction

        In the realm of algorithmic trading, technical analysis plays a pivotal role in deciphering market trends and making informed investment decisions. One of the fundamental tools employed in technical analysis is the Simple Moving Average (SMA). The SMA calculates the average price of an asset over a specific period, providing a smoothed representation of its price movement.

        Lumibot, a powerful Python library, simplifies the process of retrieving historical price data and applying technical analysis techniques. In this blog post, we will delve into how to effectively use Lumibot’s get_historical_prices function to obtain historical price data for an asset and subsequently calculate its Simple Moving Average.

        Leveraging SMA for Effective Trading Strategies

        The Simple Moving Average (SMA) is a versatile technical indicator that can be used to create various trading strategies. Here are five pointers on how to incorporate SMA into your trading bot:

        1. Trend Following Strategies:

        • Identify Uptrends: When the price consistently trades above the SMA, it suggests an uptrend. This indicates that the asset’s price is likely to continue rising. Your trading bot can use this signal to enter long positions.
        • Identify Downtrends: Conversely, if the price consistently trades below the SMA, it suggests a downtrend, indicating a potential price decline. Your bot can use this signal to enter short positions.

        Example: A trading bot might use a 50-day SMA and a 200-day SMA. If the 50-day SMA consistently trades above the 200-day SMA, it could indicate a bullish trend, prompting the bot to enter a long position.

        2. Crossover Strategies:

        • Golden Cross: A crossover occurs when a shorter-term SMA (e.g., 50-day) crosses above a longer-term SMA (e.g., 200-day). This is often interpreted as a bullish signal, suggesting a potential uptrend.
        • Death Cross: A crossover occurs when a longer-term SMA crosses below a shorter-term SMA. This is often interpreted as a bearish signal, indicating a potential downtrend.

        Example: A trading bot might use a 50-day SMA and a 200-day SMA. If the 50-day SMA crosses above the 200-day SMA (a Golden Cross), the bot could initiate a buy order, and if the 50-day SMA crosses below the 200-day SMA (a Death Cross), the bot could initiate a sell order.

        3. Mean Reversion Strategies:

        • Identify Overbought/Oversold Conditions: When the price deviates significantly from the SMA, it might indicate an overbought or oversold condition. An overbought condition suggests that the price is likely to fall, while an oversold condition suggests a potential price increase.
        • Trading Signals: Your bot can use these signals to sell when the price is overbought and buy when the price is oversold, assuming that prices will eventually return to the average level.

        Example: A trading bot might calculate the percentage difference between the current price and the 200-day SMA. If the difference is significantly positive (e.g., above 3 standard deviations), it might indicate an overbought condition, prompting the bot to sell.

        4. Support and Resistance Strategies:

        • Support Level: The SMA can act as a support level, especially during downtrends. If the price reaches the SMA and then bounces back up, it might signal a potential buying opportunity.
        • Resistance Level: The SMA can also act as a resistance level, especially during uptrends. If the price reaches the SMA and then fails to break through, it might indicate a potential selling opportunity.

        Example: A trading bot might monitor the price’s relationship to the 200-day SMA. If the price consistently tests the 200-day SMA as a support level during a downtrend and then bounces back up, the bot could initiate a buy order.

        5. Combining SMA with Other Indicators:

        • Enhanced Signal Reliability: Combining SMA with other technical indicators can help to improve the accuracy and reliability of trading signals.

        Example: Combining SMA with the Relative Strength Index (RSI) can help to identify overbought and oversold conditions more effectively. If the price is above the SMA and the RSI is near the overbought level, it might suggest a potential sell signal.

        Steps To Get the Simple Moving Average of the Historical Price of an Asset with Lumibot

        Prerequisites

        Must have Python installed in the system(version 3.10 or above)Install required Python packages.

        
         pip install lumibot


        Necessary imports for running the Python file.

        
        from lumibot.strategies import Strategy
        import pandas_ta as ta


        Create ALPACA_CONFIG with API KEY and API SECRET by logging in or signing up at https://alpaca.markets/.………..

        Steps for Using Simple Moving Average of the Historical Price of an Asset

        Step 1: Add ALPACA_CONFIG Details

        Alpaca is a broker, just like the interactive broker. The details below are required to use the Alpaca broker API.

        ALPACA_CONFIG = {
            "API_KEY": "YOUR_API_KEY_HERE", # Get your API Key from
        https://alpaca.markets/
            "API_SECRET": "YOUR_SECRET_HERE", # Get your secret from
        https://alpaca.markets/
            "PAPER":True # Set to False for real money
        }
        

        Step 2: Create a GetHistoricalPrice Class 

        Once you have added the Alpaca config detail, create a GetHistoricalPrice class, which will inherit the Strategy class as below.

        class GetHistoricalPrice(Strategy):
        

        Step 3: Add on_trading_iteration() Method

        Once you have added the initialize method, follow with the creation of  on_trading_iteration() method as below:

         def on_trading_iteration(self):
        
                # Retrieve historical prices
                bars = self.get_historical_prices("AAPL", 10, "day")
               
                df = bars.df
        
                # Calculate the 10-day Simple Moving Average (SMA)
                df['SMA_10'] = ta.sma(df['close'], length=10)
            
                # Log a message if the last SMA value is greater than 20
                if df['SMA_10'].iloc[-1] > 200:
                    self.log_message("SMA is more than 200")
        
                else:
                    self.log_message("SMA is less than or equal to 200")
            
                # Print the DataFrame for debugging
                print(df)      

        The provided code snippet defines a function that retrieves historical price data for AAPL, calculates a 10-day Simple Moving Average (SMA), and prints the resulting DataFrame. This function could be used to analyze market trends, identify potential trading opportunities, or backtest trading strategies.

        Note 1: Running the Code in the Same File 

        In Python, if __name__ == “__main__”: is a conditional statement, which allows you to control the execution of code depending on whether the script is run directly or imported as a module. This implies that the code will run only if runs as a script and not as a module. 

        if __name__ == "__main__": 
        

        Step 4: Import Alpaca and Trader 

        Import Alpaca and Trader classes from Lumibot.brokers and Lumibot.traders modules. While Alpaca is an interface to the Alpaca trading platform, it leverages us with the functionalities to interact with the Alpaca API for implementing things like placing orders, managing positions, and fetching market data like Historical Price Data, which we are doing in this blog.

        The Trader class helps orchestrate the trading process, managing multiple trading strategies, interacting with brokers like Alpaca, Interactive Brokers, and Tradiers, handling order execution and position management, and ensuring a framework for live trading and backtesting.

        from lumibot.brokers import Alpaca
        from lumibot.traders import Trader


        Step 5: Create Trader Class Object

        As you import the Alpaca and Trader class, create the trader object of the Trader() class. This object will be responsible for handling trading strategies and interactions with the Alpaca API. It can potentially execute trades, analyze market data, and implement various trading algorithms.

         trader = Trader()


        Step 6: Create an Object of Alpaca Class

        On creation of the trader class object, create the object of the Alpaca class by passing the Alpaca_Config array created above.

         broker = Alpaca(ALPACA_CONFIG)


        Step 7: Create an Object of GetHistoricalPrice Class

        Once we have created the object for the Alpaca class, we will create an object of the GetHistoricalPrice class by passing the Alpaca object (broker) as a parameter to the GetHistoricalPrice class. 

         strategy = GetHistoricalPrice(broker=broker)


        Step 8: Pass the Strategy to the Trader Class Object

        On creation of the object of the GetHistoricalPrice class, add the strategy to the trader class object using the add_strategy() method.

        trader.add_strategy(strategy)

        Step 9: Start the Overall Trading Process

        The code below starts the overall trading process. This typically executes backtesting or a live trading process for a collection of strategies within a trading platform. This command starts the execution engine. It establishes the connection with a broker, which is Alpaca, and starts background tasks like market data ingestion and order management. Briefly, it is the starting point of the trading process.

        trader.run_all()


        Complete Code

        from lumibot.strategies import Strategy
        import pandas_ta as ta
        
        ALPACA_CONFIG = {
            "API_KEY": "",
            "API_SECRET": "",
            "PAPER": True
        }
        
        class GetHistoricalPrice(Strategy):
        
            def on_trading_iteration(self):
        
                # Retrieve historical prices
                bars = self.get_historical_prices("AAPL", 10, "day")
               
                df = bars.df
        
                # Calculate the 10-day Simple Moving Average (SMA)
                df['SMA_10'] = ta.sma(df['close'], length=10)
            
                # Log a message if the last SMA value is greater than 20
                if df['SMA_10'].iloc[-1] > 200:
                    self.log_message("SMA is more than 200")
        
                else:
                    self.log_message("SMA is less than or equal to 200")
            
                # Print the DataFrame for debugging
                print(df)      
                    
        
        if __name__ == "__main__":
        
            from lumibot.brokers import Alpaca
            from lumibot.traders import Trader
        
            trader = Trader()
            broker = Alpaca(ALPACA_CONFIG)
            strategy = GetHistoricalPrice(broker=broker)
            trader.add_strategy(strategy)
            trader.run_all()


        Output

        Conclusion

        The Simple Moving Average (SMA) is a versatile technical indicator that can be effectively used in trading strategies. By following the steps outlined in this guide, you can retrieve historical price data using Lumibot, calculate the SMA, and leverage it to identify trends, generate trading signals, and make informed investment decisions. Lumibot simplifies the process of retrieving historical price data and calculating the SMA, making it a valuable tool for traders of all levels. The SMA provides valuable insights into market trends, support and resistance levels, and potential trading opportunities. Combining SMA with other technical indicators can further enhance the accuracy and reliability of trading signals. Start your algorithmic trading journey today by incorporating the SMA into your trading strategies using Lumibot.


        Categories
        Algorithmic Trading

        How to Get Multiple Asset’s Historical Prices Using Lumibot’s get_historical_prices_for_assets

        Introduction

        Crafting effective trading strategies requires a solid foundation – historical price data. This data acts as a window into an asset’s past performance, revealing valuable insights for backtesting, fundamental analysis, and long-term trend identification. Lumibot, a Python library designed for algorithmic trading, simplifies the process of acquiring historical price data for multiple assets simultaneously. This article focuses explicitly on the get_historical_prices_for_assets method, allowing you to efficiently retrieve historical price information for assets like AAPL and MSFT.

        Here’s what Lumibot’s get_historical_prices_for_assets offers:

        • Flexibility: Retrieve data for various asset types, including stocks, ETFs, cryptocurrencies, and more (depending on your data source configuration).
        • Efficiency: Fetch data for multiple assets in one call, saving time and effort compared to individual requests.
        • Customization: Control the data timeframe (e.g., daily, hourly) and granularity (e.g., including after-hours data) to fit your specific needs.

        By leveraging historical price data through Lumibot, you can unlock new possibilities for your trading bot development.

        Advantages of Historical Data in Algorithmic Trading

        Historical data plays a crucial role in algorithmic trading, providing valuable insights for developing and optimizing strategies. Here are some of the key advantages:

        1. Pattern Recognition

        • Identifying Trends: Historical data can help identify trends, such as uptrends, downtrends, and sideways movements, which can be used to inform trading decisions.
        • Recognizing Chart Patterns: Patterns like head and shoulders, double tops/bottoms, and triangles can be detected in historical data, providing potential signals for future price movements.

        2. Statistical Analysis

        • Volatility Analysis: Historical data can be used to calculate volatility metrics, such as standard deviation and beta, which are essential for risk management.
        • Correlation Analysis: By analyzing correlations between different assets, traders can construct diversified portfolios and hedge risk.

        3. Machine Learning

        • Training Models: Historical data can be used to train machine learning models, such as neural networks and support vector machines, to predict future price movements.
        • Time series forecasting: Historical data enables time series forecasting, predicting future market trends and patterns.

        4. Risk Management

        • Stop-Loss and Take-Profit Levels: Historical data can be used to set appropriate stop-loss and take-profit levels based on past price movements and volatility.
        • Position Sizing: By analyzing historical data, traders can determine optimal position sizes to manage risk effectively.

        5. Market Analysis

        • Fundamental Analysis: Historical data on financial statements, economic indicators, and industry trends can be used to assess the underlying value of assets.
        • Sentiment Analysis: Analyzing historical news and social media sentiment can provide insights into market sentiment and potential price movements.

        By effectively utilizing historical data, algorithmic traders can develop robust and profitable strategies that have a solid foundation in past market behavior.practical implementation of get_historical_prices_for_assets in Lumibot.

        Steps To Use get_historical_prices_for_assets() Method in Lumibot

        Prerequisites

        Must have Python installed in the system(version 3.10 or above)Install required Python packages.

        
         pip install lumibot
        

        Necessary imports for running the Python file.

        from lumibot.strategies import Strategy
        import pandas_ta as ta

        Create ALPACA_CONFIG with API KEY and API SECRET by logging in or signing up at https://alpaca.markets/.………..

        Steps for Using get_historical_price()

        Step 1: Add ALPACA_CONFIG Details

        Alpaca is a broker, just like the interactive broker. The details below are required to use the Alpaca broker API.

        ALPACA_CONFIG = {
            "API_KEY": "YOUR_API_KEY_HERE", # Get your API Key from
        https://alpaca.markets/
            "API_SECRET": "YOUR_SECRET_HERE", # Get your secret from
        https://alpaca.markets/
            "PAPER":True # Set to False for real money
        }

        Step 2: Create a GetHistoricalPrice Class 

        Once you have added the Alpaca config detail, create a GetHistoricalPrice class, which will inherit the Strategy class as below.

        class GetHistoricalPrice(Strategy):
        

        Step 3: Add  on_trading_iteration() Method 

        Once you have added the initialize method, follow with the creation of  on_trading_iteration() method as below:

          def on_trading_iteration(self):
                """Get the historical price for assets"""
        
                # Fetch historical prices for multiple assets
                bars = self.get_historical_prices_for_assets(["AAPL", "MSFT"], 10, "day")
        
                for symbol, asset_data in bars.items():
                    # Log the DataFrame of historical prices
        
                    self.log_message(f"Historical prices for {symbol}:\n{asset_data.df}")


        The code snippet is fetching historical price data for two assets, AAPL and MSFT, over the last 10 days. The data is retrieved in the form of DataFrames. The function then logs these DataFrames, providing a detailed view of the historical prices for each asset. This information can be used for further analysis or trading strategies.

        Note: The bars  variable is assigned its value through:

          bars = self.get_historical_prices_for_assets(["AAPL", "MSFT"], 10, "day")
        

        The data stored in bars is, hence, like open price, close price, etc., as mentioned above. Some others can be volume and dividend.

        Further details

        for symbol, asset_data in bars.items():
                    # Log the DataFrame of historical prices
        
                    self.log_message(f"Historical prices for {symbol}:\n{asset_data.df}")
        

        The above code iterates over the dictionary of asset data, where the keys are symbols, and the values are DataFrames containing historical prices. For each asset, it logs the symbol and its corresponding DataFrame, providing a detailed view of the historical price data.

        Note 1: Running the Code in the Same File 

        In Python, if __name__ == “__main__”: is a conditional statement, which allows you to control the execution of code depending on whether the script is run directly or imported as a module. This implies that the code will run only if runs as a script and not as a module.

        if __name__ == "__main__": 

        Step 4: Import Alpaca and Trader

        Import Alpaca and Trader classes from Lumibot.brokers and Lumibot.traders modules. While Alpaca is an interface to the Alpaca trading platform, it leverages us with the functionalities to interact with the Alpaca API for implementing things like placing orders, managing positions, and fetching market data like Historical Price Data, which we are doing in this blog.

        The Trader class helps orchestrate the trading process, managing multiple trading strategies, interacting with brokers like Alpaca, Interactive Brokers, and Tradiers, handling order execution and position management, and ensuring a framework for live trading and backtesting. 

        from lumibot.brokers import Alpaca
        from lumibot.traders import Trader

        Step 5: Create Trader Class Object

        As you import the Alpaca and Trader class, create the trader object of the Trader() class.

         trader = Trader()

        Step 6: Create an Object of Alpaca Class

        On creation of the trader class object, create the object of the Alpaca class by passing the Alpaca_Config array created above.

        broker = Alpaca(ALPACA_CONFIG)

        Step 7: Create an Object of GetHistoricalPrice Class

        Once we have created the object for the Alpaca class, we will create an object of the GetHistoricalPrice class by passing the Alpaca object (broker) as a parameter to the GetHistoricalPrice class. 

         strategy = GetHistoricalPrice(broker=broker)
        

        Step 8: Pass the Strategy to the Trader Class Object

        On creation of the object of the GetHistoricalPrice class, add the strategy to the trader class object using the add_strategy() method.

        trader.add_strategy(strategy)


        Step 9: Start the Overall Trading Process

        The code below starts the overall trading process. This typically executes backtesting or a live trading process for a collection of strategies within a trading platform. This command starts the execution engine. It establishes the connection with a broker, which is Alpaca, and starts background tasks like market data ingestion and order management. Briefly, it is the starting point of the trading process.

        trader.run_all()
        

        Complete Code

        from lumibot.strategies import Strategy
        
        ALPACA_CONFIG = {
            "API_KEY": "",
            "API_SECRET": "",
            "PAPER": True
        }
        
        class GetHistoricalPrice(Strategy):
        
            def on_trading_iteration(self):
                """Get the historical price for assets"""
        
                # Fetch historical prices for multiple assets
                bars = self.get_historical_prices_for_assets(["AAPL", "MSFT"], 10, "day")
        
                for symbol, asset_data in bars.items():
                    # Log the DataFrame of historical prices
        
                    self.log_message(f"Historical prices for {symbol}:\n{asset_data.df}")
        
        if __name__ == "__main__":
        
            from lumibot.brokers import Alpaca
            from lumibot.traders import Trader
        
            trader = Trader()
            broker = Alpaca(ALPACA_CONFIG)
            strategy = GetHistoricalPrice(broker=broker)
            trader.add_strategy(strategy)
            trader.run_all()


        Output

        Conclusion

        Lumibot’s get_historical_prices_for_assets method offers a powerful tool for efficiently retrieving historical price data for multiple assets. By leveraging this data, you can enhance your trading strategies, make informed decisions, and gain a competitive edge in the market.

        Start exploring the possibilities with Lumibot today! Visit the Lumibot documentation and begin building your trading bot strategies:


        Categories
        Algorithmic Trading Uncategorized

        How to Get an Asset’s Historical Prices Using Lumibot 

        Introduction

        Whether it is the daily historical data, tick level data, or the order book data, all these are the historical pricing details of an Asset for a specified period and used in the trading bot to craft simplest to most complex strategies, fundamental analysis, long term trend analysis and fulfilling loads of other requirements. When used in a trading bot, historical price data allows traders to plan their strategies based on the historical performance of that particular asset. In addition to Historical price data being handy for investment analysis, it is also beneficial when it comes to risk assessment and valuation. Hence, traders can do wonders in their trading bot using historical prices. 

        Historical data on securities can serve as a record source of information for investors, analysts, and traders, which they can use to develop a more successful trading bot. The knowledge of the past performance of securities while creating the trading bot can help trading programmers gain valuable insights into market trends, and it can also help them make informed investment decisions through their trading bot strategies. Lumibot is a Python trading library that lets us quickly grab the asset’s historical prices, which can be further used to code highly effective strategy. 

        Read on to find out how historical Price Data can be used and how it can be easily fetched from possible sources using Lumibot. 

        Why You Should Use Historical Data in Your Trading Bot

        Historical prices are financial data saved at various intervals, whether days, minutes, or annually. Different historical data types are daily, tick-level, and order-type data. While daily data is suitable for low-frequency trading strategies, the tick-level data is good for high-frequency trading strategies. The importance of using historical data in a trading bot can be understood by realizing that adding historical data to a trading bot can help you make predictions based on past occurrences. Such data can be used in various cases, including below. 

        Investment Analysis

        The knowledge of past data can not only help us understand future trends but can also help us make informed decisions. Such information is what traders use manually to earn profit in trading, and the same information can be used to program a proper strategy, which is essential when making the trading bot.

        1. Valuation

        The valuation of securities is crucial while creating a trading bot strategy, and it’s easier to make a trading bot with such information. With the help of historical prices, it is possible to calculate the intrinsic value and compare it with the market price. Intrinsic value, when compared to the stock’s current market value, helps to determine whether the stock is a good buy or a good sale. The stock is supposed to be a good buy when the current market price of that stock is less than its intrinsic value.

        1. Risk Assessment 

        Historical volatility is a statistical evaluation of the distribution of returns for a given financial instrument (security) or market index over a given period. In general, this measure is calculated by calculating the average deviation compared to a security’s average price over a given period. The more volatility there is, the riskier the asset is for trading. Historical volatility is calculated using the asset’s historical price data. This information plays a very crucial role in creating a trading bot strategy, as no strategy is complete without proper risk management.

        1. Machine Learning and Sentiment Analysis

        Some bots employ machine learning algorithms to adapt and learn from market data, such as historical price data, and improve their trading strategies. While news plays an essential role in sentiment analysis as well as social media information, historical price data cannot be discarded when it comes to algorithmic trading. Bots could react to historical price data, much like news and social media trends, in real time.

        Steps To Use get_historical_price() Method in Lumibot

        Prerequisites

        Must have Python installed in the system(version 3.10 or above)Install required Python packages.

        pip install lumibot
        

        Necessary imports for running the Python file.

        from lumibot.strategies import Strategy

        Create ALPACA_CONFIG with API KEY and API SECRET by logging in or signing up at https://alpaca.markets/

        Steps for Using get_historical_price()

        Step 1: Add ALPACA_CONFIG Details

        Alpaca is a broker, just like the interactive broker. The details below are required to use the Alpaca broker API.

        ALPACA_CONFIG = {
            "API_KEY": "YOUR_API_KEY_HERE", # Get your API Key from
        https://alpaca.markets/
            "API_SECRET": "YOUR_SECRET_HERE", # Get your secret from
        https://alpaca.markets/
            "PAPER":True # Set to False for real money
        }

        Step 2: Create a GetHistoricalPrice Class 

        Once you have added the Alpaca config detail, create a GetHistoricalPrice class, which will inherit the Strategy class as below.

        class GetHistoricalPrice(Strategy):

        Step 3: Add  on_trading_iteration() Method 


        Once you have added the initialize method, follow with the creation of  on_trading_iteration() method as below:

         def on_trading_iteration(self):
                """Get the historical price for an asset"""
        
        
                bars = self.get_historical_prices("AAPL", 10, "day")
                df = bars.df
        
                print(df)
        
                last_ohlc = df.iloc[-1]
        
        
                self.log_message(f"The last closing price of AAPL: {last_ohlc['close']}")
                # Calculate the maximum closing price over the last ten days
        
                max_close = df['close'].max()
                self.log_message(f"Maximum closing price of AAPL over the last 10 days: {max_close}")
        
                # Check if the last closing price is the highest
        

        The above code snippet creates the on_trading_iteration() method, which chiefly fetches the asset’s historical price. Details of each term used are below:

        Bars: This refers to the price bar or candlestick, which is a graphical representation of the price movement over a specific period of time. There is an open price, high price, low price, and close price, which are self-understood from the terms. For example, a high price means the highest price reached during the period. However, the bars here are variable and have been named as such. For example, the output from the get_historical_price() will have data ranging from open price to dividend and volume. 

        bars.df: This is the panda data frame of the historical price data of the specified asset.

        Note: The bars  variable is assigned its value through:

        bars =  self.get_historical_prices("AAPL", 10, "day")
        

        The data stored in bars is, hence, like open price, close price, etc., as mentioned above. Some others can be volume and dividend.

        Iloc[-1]: This integer-location-based indexing method allows users to access data in specific positions in the data frame. It is strictly integer-based, starting from 0 to the length-1 of the axis, and is used for retrieving rows and columns by integer positions.

        The above will assign the values from the last row of the PDF to the last_ohlc variable. This variable will store the OHLC (Open, High, Low, Close) data for the last period. The data in the last_ohlc variable can then be applied for further analysis to calculate the most recent OHLC values. Above, we are extracting the last closing price from the data frame and checking whether it is the maximum.

        Note 1: Running the Code in the Same File 

        In Python, if __name__ == “__main__”: is a conditional statement, which allows you to control the execution of code depending on whether the script is run directly or imported as a module. This implies that the code will run only if runs as a script and not as a module. 

        if __name__ == "__main__": 

        Step 4: Import Alpaca and Trader 

        Import Alpaca and Trader classes from Lumibot.brokers and Lumibot.traders modules. While Alpaca is an interface to the Alpaca trading platform, it leverages us with the functionalities to interact with the Alpaca API for implementing things like placing orders, managing positions, and fetching market data like Historical Price Data, which we are doing in this blog.

        The Trader class helps orchestrate the trading process, managing multiple trading strategies, interacting with brokers like Alpaca, Interactive Brokers, and Tradiers, handling order execution and position management, and ensuring a framework for live trading and backtesting. 

        from lumibot.brokers import Alpaca
        from lumibot.traders import Trader
        

        Step 5: Create Trader Class Object

        As you import the Alpaca and Trader class, create the trader object of the Trader() class.

        trader = Trader()
        

        Step 6: Create an Object of Alpaca Class

        On creation of the trader class object, create the object of the Alpaca class by passing the Alpaca_Config array created above.

        broker = Alpaca(ALPACA_CONFIG)
        

        Step 7: Create an Object of GetHistoricalPrice Class

        Once we have created the object for the Alpaca class, we will create an object of the GetHistoricalPrice class by passing the Alpaca object (broker) as a parameter to the GetHistoricalPrice class. 

        strategy = GetHistoricalPrice(broker=broker)
        

        Step 8: Pass the Strategy to the Trader Class Object

        On creation of the object of the GetHistoricalPrice class, add the strategy to the trader class object using the add_strategy() method.

        trader.add_strategy(strategy)
        

        Step 9: Start the Overall Trading Process

        The code below starts the overall trading process. This typically executes backtesting or a live trading process for a collection of strategies within a trading platform. This command starts the execution engine. It establishes the connection with a broker, which is Alpaca, and starts background tasks like market data ingestion and order management. Briefly, it is the starting point of the trading process.

        trader.run_all()
        

        Complete Code

        Below is the entire code. Simply paste the code below in a gethistprice.py file, add the Alpaca API and secret keys, install the prerequisites, and run the code. However, ensure the market is open, which applies to US markets. The pre-trading hours start at 4 a.m. and end at 9:30 a.m. The regular trading hours begin at 9:30 a.m. and end at 4 p.m., and the after-trading hours last from 4 p.m. to 8 p.m. All timings are in Eastern Time (ET). Run the below code during regular trading hours.

        from lumibot.strategies import Strategy
        
        ALPACA_CONFIG = {
            "API_KEY": "",
            "API_SECRET": "",
            "PAPER": True,
        }
        
        class GetHistoricalPrice(Strategy):
        
            def on_trading_iteration(self):
                """Get the historical price for an asset"""
        
        
                bars = self.get_historical_prices("AAPL", 10, "day")
                df = bars.df
        
                print(df)
        
                last_ohlc = df.iloc[-1]
        
        
                self.log_message(f"The last closing price of AAPL: {last_ohlc['close']}")
                # Calculate the maximum closing price over the last 10 days
        
                max_close = df['close'].max()
                self.log_message(f"Maximum closing price of AAPL over the last 10 days: {max_close}")
        
                # Check if the last closing price is the highest
        
        
        if __name__ == "__main__":
            from lumibot.brokers import Alpaca
            from lumibot.traders import Trader
        
            trader = Trader()
            broker = Alpaca(ALPACA_CONFIG)
            strategy = GetHistoricalPrice(broker=broker)
            trader.add_strategy(strategy)
            trader.run_all()


        Output

        Conclusion

        Not only can historical price data help traders discover trading opportunities, risk management, and portfolio development, but it also helps evaluate strategies through backtesting. Nowadays, with new technologies like machine learning and sentiment analysis, the historical price data, whether daily, intra-day, tick level, or order type, have become even more powerful weapons for traders as they can predict future trends and compete better with their competitors. New storage technologies from cloud service providers have made the heavy storage requirements quite cheaper. However, having this historical data in-house is not always possible, and the attributes vary for different assets. Thanks to third-party data sources, which now provide highly accurate historical data in real-time. Are you looking to use the asset’s historical price in your Python trading bot using Lumibot to backtest and optimize your trading strategy? Developed by expert developers and financial experts at Lumiwealth, Lumibot is a trading framework that can effortlessly help you add an asset’s historical price to even the most complex trading strategies. Visit our site now to register for a training course where our expert programmers with ample knowledge in trading will teach you the nitty-gritty of algorithmic trading programming in Python using Lumibot.


        Categories
        Algorithmic Trading

        Unlocking the Power of Python in Option Trading: A Comprehensive Guide

        In the ever-evolving world of trading, Python has emerged as a powerhouse language, enabling traders to build sophisticated trading strategies with ease. Python’s versatility and extensive libraries make it a perfect choice for automating trading strategies, especially in Python Option Trading. At Lumiwealth, an educational platform dedicated to teaching algorithmic trading and investing, you can learn how to harness the full potential of Python to optimize your trading performance.

        Understanding Python Option Trading

        Option trading involves buying and selling options contracts, which give the holder the right, but not the obligation, to buy or sell an underlying asset at a specified price before a certain date. The flexibility of options makes them a popular choice among traders looking to hedge their portfolios or speculate on market movements. However, the complexity of options trading requires a robust and flexible toolset, which is where Python comes into play.

        Python offers numerous libraries and frameworks, such as NumPy, Pandas, and SciPy, that facilitate the analysis and manipulation of financial data. By leveraging these tools, traders can develop and backtest their own trading strategies, ensuring they are both effective and efficient.

        Why Choose Python for Option Trading?

        1. Versatility: Python’s simplicity and readability make it accessible to traders with varying levels of programming experience. Whether you are a beginner or an advanced trader, Python offers a gentle learning curve and a supportive community.
        2. Extensive Libraries: Python’s extensive range of libraries allows traders to perform complex calculations, data analysis, and visualization with minimal effort. Libraries like Pandas and NumPy are particularly useful for handling time-series data and performing statistical analysis.
        3. Automation: One of the key advantages of using Python is the ability to automate trading strategies. Automation not only saves time but also eliminates the emotional biases that can affect trading decisions.
        4. Backtesting: Python enables traders to backtest their strategies against historical data, providing valuable insights into their potential performance. This process helps identify any weaknesses in the strategy and allows for adjustments before deploying it in a live trading environment.

        Getting Started with Python Option Trading

        To effectively use Python in option trading, it’s essential to familiarize yourself with the basics of both options trading and Python programming. Lumiwealth offers a range of courses designed to cater to different skill levels, ensuring that you have the necessary foundation to build and deploy your trading algorithms.

        1. Basic Python Programming

        Before diving into option trading, it’s crucial to have a solid understanding of Python programming. Start with the basics, such as data types, loops, and functions. Once you are comfortable with these concepts, you can move on to more advanced topics, such as object-oriented programming and working with libraries like Pandas and NumPy.

        2. Understanding Options

        Next, you need to grasp the fundamentals of options trading. Learn about the different types of options (calls and puts), how they are priced, and the various strategies traders use to profit from market movements. Lumiwealth provides comprehensive resources and courses that cover these topics in detail.

        3. Developing Trading Strategies

        Once you have a good understanding of Python and options trading, you can start developing your trading strategies. This involves identifying market patterns, setting entry and exit points, and determining risk management techniques. Python’s libraries make it easy to implement these strategies and analyze their performance.

        4. Backtesting and Optimization

        Backtesting is essential in crafting any trading strategy. By testing your strategy on historical data, you can assess its performance and refine it as needed. Lumiwealth’s courses guide you in backtesting your strategies using Python, ensuring they are both robust and effective.

        5. Deploying Your Strategy

        After backtesting and optimizing your strategy, you can deploy it in a live trading environment. Automation tools like Lumiwealth’s Lumibot can help you execute trades automatically, ensuring that your strategy is followed precisely.

        Advanced Topics: Algo Trading with Options

        For those looking to delve deeper, you can explore more advanced topics, such as Algo Trading with Options. Algo trading, or algorithmic trading, involves using algorithms to execute trades based on predefined criteria. This approach can be particularly effective in options trading, where the complexity of the instruments can benefit from the precision and speed of algorithmic execution.

        Lumiwealth offers advanced courses that cover topics such as:

        • Algorithm Development: Learn how to develop algorithms that can identify trading opportunities and execute trades automatically.
        • Machine Learning: Explore how machine learning techniques can be applied to trading strategies to enhance their performance.
        • Risk Management: Understand the importance of risk management in algo trading and how to implement effective risk controls in your algorithms.

        The Future of Python in Trading

        The future of trading is undoubtedly moving towards greater automation and data-driven decision-making. Python, with its powerful libraries and supportive community, is at the forefront of this revolution. By learning Python for option trading through Lumiwealth, you can equip yourself with the skills needed to thrive in this dynamic environment.

        Whether you are a beginner looking to get started with trading or an experienced trader seeking to enhance your strategies, Lumiwealth provides the resources and expertise you need. With their comprehensive courses and hands-on approach, you can confidently navigate the world of trading and unlock new opportunities for financial success.

        Conclusion

        Python option trading offers a powerful and flexible approach to navigating the complexities of the financial markets. By leveraging the capabilities of Python, traders can develop, backtest, and deploy sophisticated trading strategies with ease. Lumiwealth’s educational platform provides the knowledge and tools, empowering you to make informed investment decisions and enhance your trading performance.

        Start your journey today with Lumiwealth and discover the potential of Python in revolutionizing your approach to option trading. Whether you’re automating your trades or exploring algo trading with options, the future of trading is at your fingertips.