Introduction
Many technical analysis challenges, such as identifying market trends and determining entry or exit points, can be effectively addressed using Bollinger Bands in a trading bot. Bollinger Bands helps solve these issues by providing a dynamic range around the price that signals overbought or oversold conditions, making it easier for a trading bot to make informed decisions. With the rise of automated trading platforms like Lumibot, traders can seamlessly integrate Bollinger Bands into their bots for real-time technical analysis. Lumibot’s user-friendly interface and robust API make it a perfect tool for implementing Bollinger Bands strategies in an automated trading setup.
Furthermore, Lumibot empowers traders to customize their Bollinger Bands parameters, such as period length and deviation settings, based on market conditions and trading objectives. This flexibility enhances a bot’s ability to react swiftly to market fluctuations, improving overall trading efficiency. Lumibot’s extensive backtesting capabilities also allow traders to refine their Bollinger Bands strategies by testing them on historical data.
How Bollinger Bands Can Be Used for Technical Analysis of an Asset: Bollinger Bands provide crucial insights into market volatility and potential price reversals, making them a valuable tool for analyzing any asset. By observing how an asset’s price behaves relative to the upper and lower bands, traders can gauge whether the asset is overbought or oversold. This helps in formulating strategies for when to enter or exit trades based on clear market signals.
Read on to find the nitty-gritty of how Bollinger Bands can be effectively incorporated into a trading bot for technical analysis of an asset.
Using Bollinger Bands in a Trading Bot for Technical Analysis
Bollinger Bands are widely used in trading strategies due to their ability to highlight market volatility, overbought/oversold levels, and potential price reversals. By incorporating Bollinger Bands into a trading bot, traders can automate decisions and capitalize on these insights. Below are five ways Bollinger Bands can be utilized in a trading bot for technical analysis, with a breakdown of what each method is and how it can be applied effectively in an automated trading system.
1. Identifying Overbought and Oversold Conditions
What It Is:
Bollinger Bands help determine whether an asset is overbought (price touching or exceeding the upper band) or oversold (price touching or dropping below the lower band). These conditions often signal a potential price reversal.
How It Can Be Used in a Trading Bot:
In a trading bot, Bollinger Bands can be programmed to trigger buy signals when the price hits the lower band (oversold) and sell signals when it hits the upper band (overbought). This allows the bot to make decisions based on predefined criteria without human intervention.
2. Volatility Breakouts (The Squeeze)
What It Is:
When the bands contract (i.e., when they come close together), it indicates reduced volatility, commonly referred to as “the squeeze.” This phase is often followed by a volatility breakout, where the price sharply moves in either direction.
How It Can Be Used in a Trading Bot:
Traders can configure a bot to monitor for contractions in Bollinger Bands. Once the bands start expanding, the bot can place orders based on the direction of the breakout (up or down). The bot can also be set to place stop-losses to manage risk in case of a false breakout.
3. Mean Reversion Strategy
What It Is:
Bollinger Bands are centered around a moving average, which acts as a benchmark for the “fair” price of the asset. When the price moves too far from this average (toward either band), it often reverts back to the mean.
How It Can Be Used in a Trading Bot:
A trading bot can be programmed to execute trades when the price moves away from the moving average toward the bands and then place opposing trades (sell or buy) when the price reverts back to the mean. This strategy works well in range-bound markets.
4. Trend Following with Bollinger Bands
What It Is:
In a strong trend, the price tends to hug one of the Bollinger Bands. In an uptrend, the price often stays near the upper band, while in a downtrend, it stays near the lower band.
How It Can Be Used in a Trading Bot:
A trading bot can be designed to open positions following the trend direction. For example, if the price is consistently hitting the upper band, the bot can place buy orders. Conversely, if the price sticks to the lower band, the bot can open sell positions, adjusting stop-losses and profit-taking points accordingly.
5. Detecting Double Tops and Bottoms
What It Is:
Bollinger Bands can help detect double tops (two peaks near the upper band signaling a potential bearish reversal) or double bottoms (two troughs near the lower band indicating a bullish reversal).
How It Can Be Used in a Trading Bot:
Bots can be configured to recognize these patterns and automatically trigger trades when they form. For example, a bot can be set to initiate a sell order after identifying a double top or a buy order after spotting a double bottom. This pattern recognition can be enhanced by combining Bollinger Bands with other indicators for better accuracy.
By incorporating these strategies, traders can enhance their trading bot’s performance and create systems that are responsive to market conditions, taking full advantage of Bollinger Bands for technical analysis.
Steps to Get the Bollinger Bands of the Historical Price of an Asset with Lumibot
Prerequisites
Must have Python installed in the system(version 3.10 or above)
- Install required Python packages.
pip install lumibot
2. Necessary imports for running the Python file.
from lumibot.strategies import Strategy
import pandas_ta as ta
3. Create ALPACA_CONFIG with API KEY and API SECRET by logging in or signing up at https://alpaca.markets/.
Steps for Using Bollinger Bands of the Historical Price of an Asset
Step 1: Add ALPACA_CONFIG Details
Alpaca is a broker, just like the interactive broker. The details below are required to use the Alpaca broker API.
ALPACA_CONFIG = {
	"API_KEY": "YOUR_API_KEY_HERE", # Get your API Key from https://alpaca.markets/
	"API_SECRET": "YOUR_SECRET_HERE", # Get your secret from https://alpaca.markets/
	"PAPER":True # Set to False for real money
}
Step 2: Create a GetHistoricalPrice Class
Once you have added the Alpaca config detail, create a GetHistoricalPrice class, which will inherit the Strategy class as below.
class GetHistoricalPrice(Strategy):
Step 3: Add on_trading_iteration() Method
Once you have added the initialize method, follow with the creation of on_trading_iteration() method as below:
def on_trading_iteration(self):

   	# Get historical prices for AAPL
       bars = self.get_historical_prices("AAPL", 30, "day")
       df = bars.df

   	# Calculate Bollinger Bands
       bbands = ta.bbands(df['close'], length=20, std=2)
       df['BB_Middle'] = bbands['BBM_20_2.0']
       df['BB_Upper'] = bbands['BBU_20_2.0']
       df['BB_Lower'] = bbands['BBL_20_2.0']

   	# Drop any rows with NaN values
       df.dropna(inplace=True)

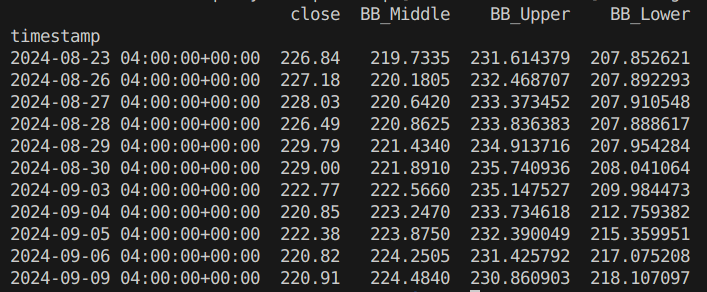
   	print(df[['close', 'BB_Middle', 'BB_Upper', 'BB_Lower']])
In this code, the function on_trading_iteration retrieves historical price data for Apple Inc. (“AAPL”) over the last 30 days, with each data point representing a day. It then calculates the Bollinger Bands for the closing prices of AAPL using a 20-day moving average and 2 standard deviations. The calculated Bollinger Bands consist of three lines: the middle band (20-day moving average), upper band (2 standard deviations above the middle), and lower band (2 standard deviations below the middle). These values are added to the dataframe df as new columns. Afterward, any rows containing missing values (NaN) are removed, and the relevant columns (close price, middle, upper, and lower Bollinger Bands) are printed to the console for analysis.
Note 1: Running the Code in the Same File
In Python, if __name__ == “__main__”: is a conditional statement, which allows you to control the execution of code depending on whether the script is run directly or imported as a module. This implies that the code will run only if runs as a script and not as a module.
if __name__ == "__main__":
Step 4: Import Alpaca and Trader
Import Alpaca and Trader classes from Lumibot.brokers and Lumibot.traders modules. While Alpaca is an interface to the Alpaca trading platform, it leverages us with the functionalities to interact with the Alpaca API for implementing things like placing orders, managing positions, and fetching market data like Historical Price Data, which we are doing in this blog.
The Trader class helps orchestrate the trading process, managing multiple trading strategies, interacting with brokers like Alpaca, Interactive Brokers, and Tradiers, handling order execution and position management, and ensuring a framework for live trading and backtesting.
from lumibot.brokers import Alpaca
from lumibot.traders import Trader
Step 5: Create Trader Class Object
As you import the Alpaca and Trader class, create the trader object of the Trader() class.
trader = Trader()
Step 6: Create an Object of Alpaca Class
On creation of the trader class object, create the object of the Alpaca class by passing the Alpaca_Config array created above.
broker = Alpaca(ALPACA_CONFIG)
Step 7: Create an Object of GetHistoricalPrice Class
Once we have created the object for the Alpaca class, we will create an object of the GetHistoricalPrice class by passing the Alpaca object (broker) as a parameter to the GetHistoricalPrice class.
strategy = GetHistoricalPrice(broker=broker)
Step 8: Pass the Strategy to the Trader Class Object
On creation of the object of the GetHistoricalPrice class, add the strategy to the trader class object using the add_strategy() method.
trader.add_strategy(strategy)
Step 9: Start the Overall Trading Process
The code below starts the overall trading process. This typically executes backtesting or a live trading process for a collection of strategies within a trading platform. This command starts the execution engine. It establishes the connection with a broker, which is Alpaca, and starts background tasks like market data ingestion and order management. Briefly, it is the starting point of the trading process.
trader.run_all()
Complete Code
from lumibot.strategies import Strategy
import pandas_ta as ta

# Alpaca API configuration
ALPACA_CONFIG = {
    "API_KEY": "YOUR_API_KEY_HERE", # Get your API Key from https://alpaca.markets/
    "API_SECRET": "YOUR_SECRET_HERE", # Get your secret from https://alpaca.markets/
    "PAPER":True # Set to False for real money
}
class GetHistoricalPrice(Strategy):

   def on_trading_iteration(self):

   	# Get historical prices for AAPL
       bars = self.get_historical_prices("AAPL", 30, "day")
       df = bars.df

   	# Calculate Bollinger Bands
       bbands = ta.bbands(df['close'], length=20, std=2)
       df['BB_Middle'] = bbands['BBM_20_2.0']
       df['BB_Upper'] = bbands['BBU_20_2.0']
       df['BB_Lower'] = bbands['BBL_20_2.0']

   	# Drop any rows with NaN values
       df.dropna(inplace=True)

   	print(df[['close', 'BB_Middle', 'BB_Upper', 'BB_Lower']])


if __name__ == "__main__":

   from lumibot.brokers import Alpaca
   from lumibot.traders import Trader

   broker = Alpaca(ALPACA_CONFIG)
   strategy = GetHistoricalPrice(broker=broker)

   trader = Trader()
   trader.add_strategy(strategy)
   trader.run_all()
Output

Conclusion
Bollinger Bands provides traders with a clear framework for analyzing market trends, detecting overbought and oversold conditions, and identifying potential breakouts. When integrated into a trading bot, Bollinger Bands can automate these insights, helping traders execute strategies with precision and without emotional bias. Tools like Lumibot simplify this automation, enabling traders to fine-tune their Bollinger Bands parameters backtest strategies and set up fully autonomous trading systems based on real-time market conditions.
By leveraging Lumibot’s advanced features, traders can unlock the full potential of Bollinger Bands, increasing their chances of success in a dynamic market environment.
Take Your Trading to the Next Level with Lumibot
Ready to harness the power of Bollinger Bands and automate your trading strategies? Lumibot offers the perfect platform to build, customize, and optimize your trading bot. Whether you’re new to automated trading or a seasoned professional, Lumibot provides intuitive tools to help you stay ahead of the market.
Sign up for Lumibot today and start integrating Bollinger Bands into your trading bot for a more efficient, data-driven trading experience!


